Fig. 11.
Download original image
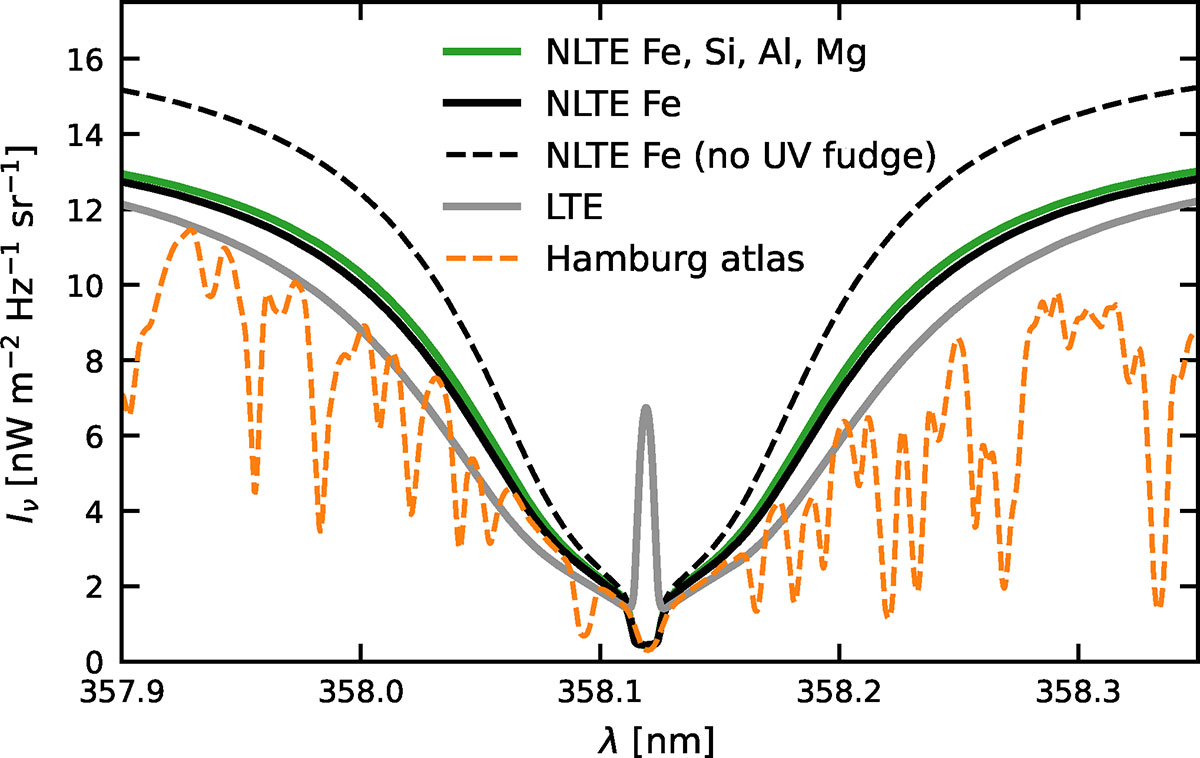
Comparison of the emerging line profile for the 358.1 nm line synthesized with different assumptions affecting the ionization balance of Fe against the Hamburg atlas. The dashed orange line shows the Hamburg atlas. The solid gray line shows the LTE synthesis, and the solid black line was synthesized with Fe treated in NLTE. Removing the UV fudge factors from the NLTE Fe synthesis results in the black dashed line. Including the fudge factors in addition to treating Si, Al, and Mg in NLTE (hence modifying the UV continuum) results in the green line.
Current usage metrics show cumulative count of Article Views (full-text article views including HTML views, PDF and ePub downloads, according to the available data) and Abstracts Views on Vision4Press platform.
Data correspond to usage on the plateform after 2015. The current usage metrics is available 48-96 hours after online publication and is updated daily on week days.
Initial download of the metrics may take a while.