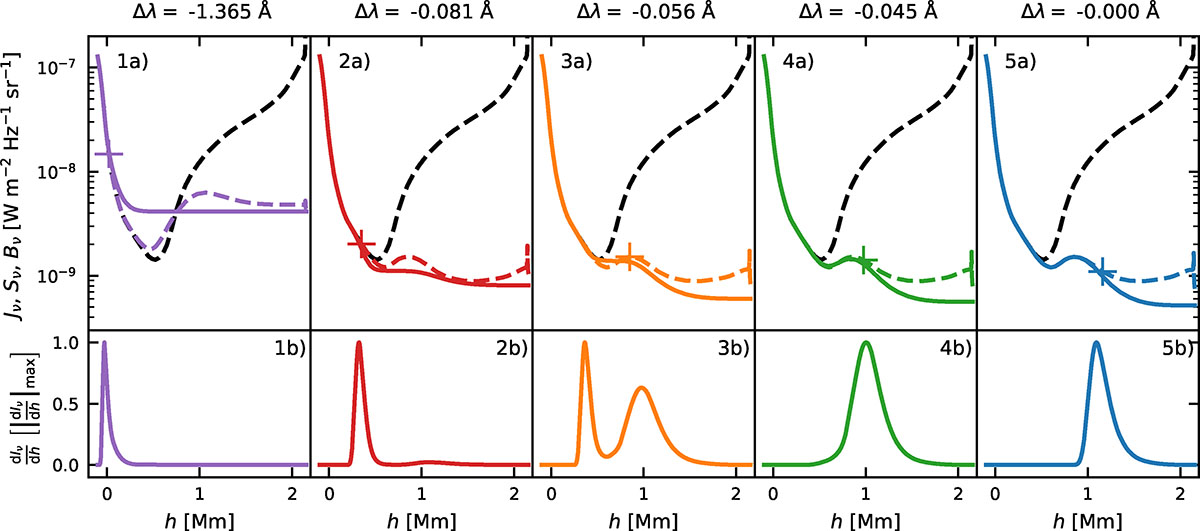
Fig. 6.
Download original image
Upper row: height stratification of the source function (colored dashed lines), angle-averaged intensity (colored solid lines), and the Planck function (dashed black line) in the FALC atmosphere. The crosses mark the locations at which τν = 1. The intensity of the four wavelength points closest to the rest wavelength is marked with crosses of corresponding color in Fig. 8. The purple line is taken from the wing at 371.85 nm. Second row: contribution functions at wavelengths corresponding to the upper row.
Current usage metrics show cumulative count of Article Views (full-text article views including HTML views, PDF and ePub downloads, according to the available data) and Abstracts Views on Vision4Press platform.
Data correspond to usage on the plateform after 2015. The current usage metrics is available 48-96 hours after online publication and is updated daily on week days.
Initial download of the metrics may take a while.