Fig. 11.
Download original image
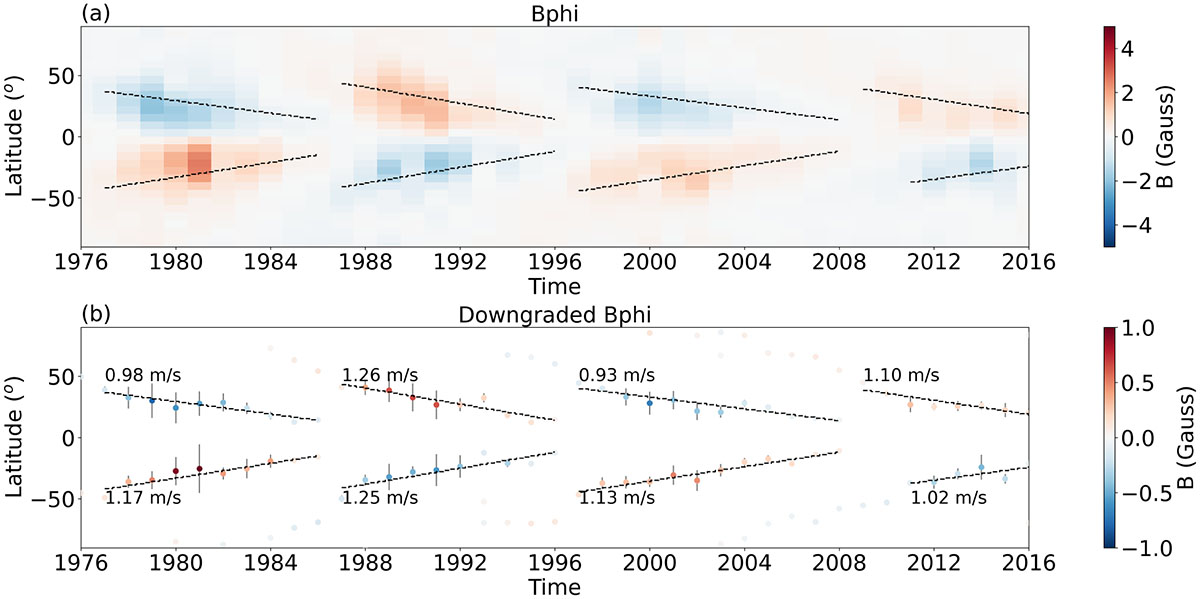
Analysis of the solar equatorward drift based on the azimuthal magnetic field (Bϕ). (a) Reconstructed butterfly diagram for Bϕ taken from Cameron et al. (2018). (b) Downgraded butterfly diagram with half the original latitudinal resolution used for the analysis. The drift speeds of different polarity regions are determined via linear fits and are indicated by dashed lines.
Current usage metrics show cumulative count of Article Views (full-text article views including HTML views, PDF and ePub downloads, according to the available data) and Abstracts Views on Vision4Press platform.
Data correspond to usage on the plateform after 2015. The current usage metrics is available 48-96 hours after online publication and is updated daily on week days.
Initial download of the metrics may take a while.