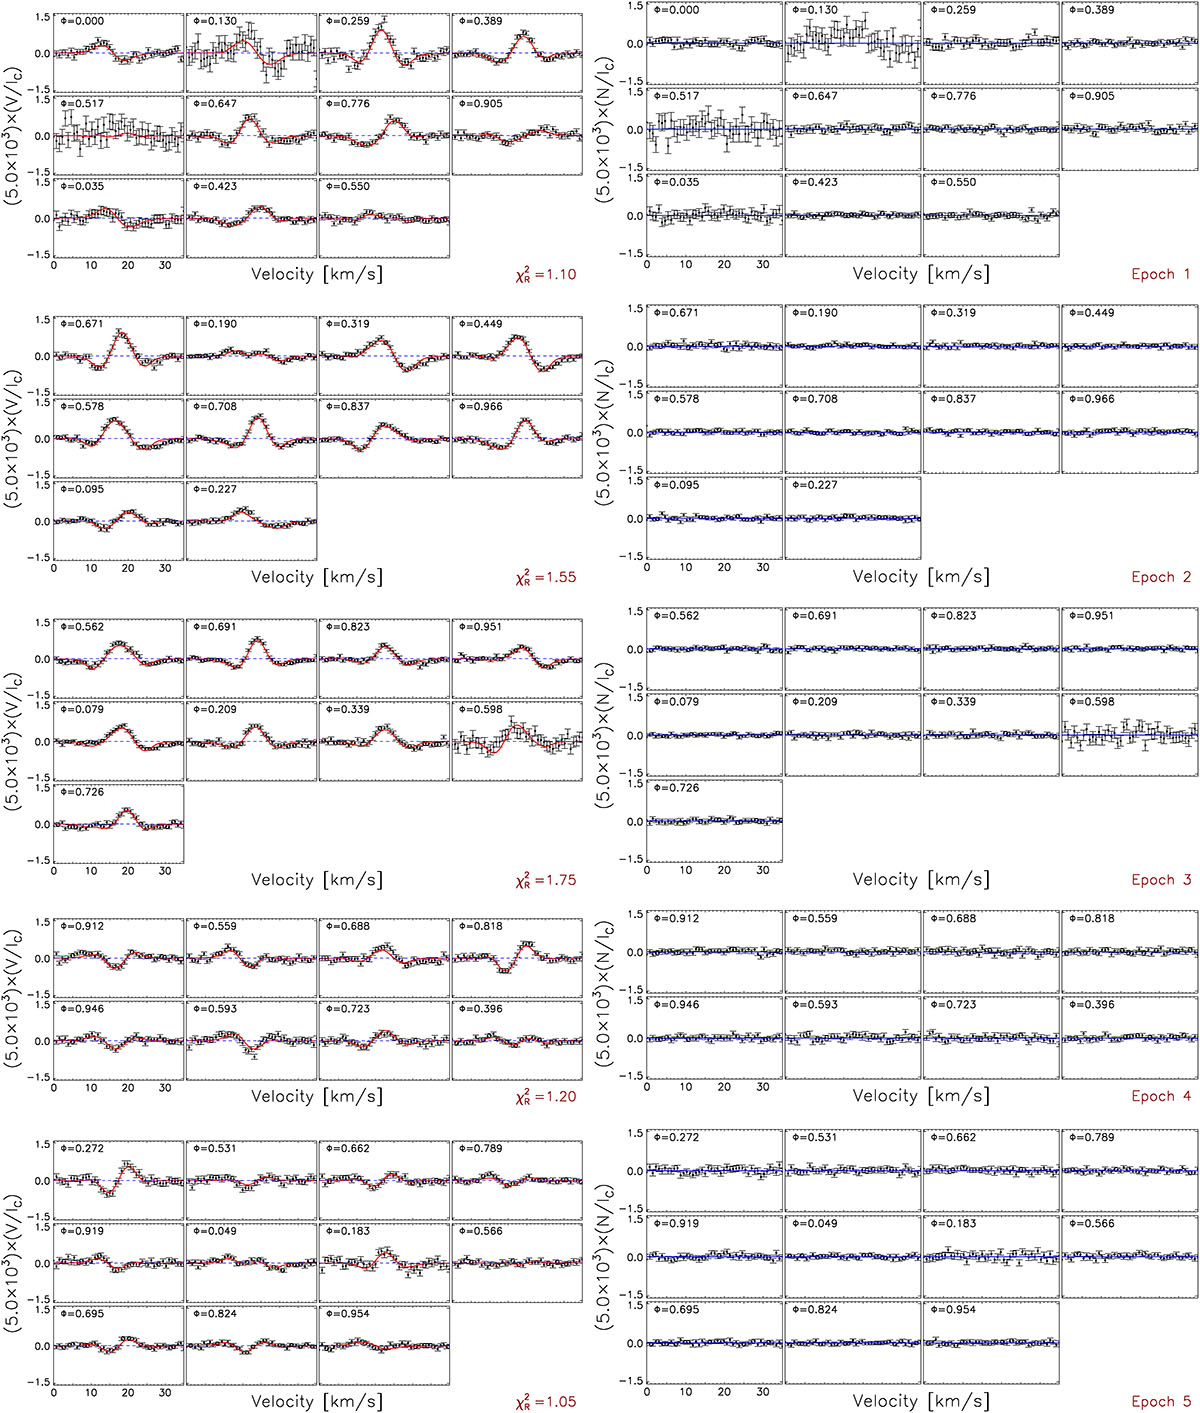
Fig. 4.
Download original image
Recovered LSD profiles from the spectropolarimetric observations of ι Hor. Each row contains a different observing epoch (Epochs 1 to 5), with individual observing phases (Φ) shown in each subpanel. Left column: ZDI fits (red) to the circularly polarized data (Stokes V, black), with the optimal reduced χR2 achieved in each case. Right column: Corresponding diagnostic null (N) spectra. Both profiles have been enhanced (by a factor of 5.0 × 10³) and normalized to the continuum intensity (IC) for visualization purposes. The ZDI fits to the remaining epochs (6 to 18) are presented in Figs. B.1–B.3.
Current usage metrics show cumulative count of Article Views (full-text article views including HTML views, PDF and ePub downloads, according to the available data) and Abstracts Views on Vision4Press platform.
Data correspond to usage on the plateform after 2015. The current usage metrics is available 48-96 hours after online publication and is updated daily on week days.
Initial download of the metrics may take a while.