Fig. 7.
Download original image
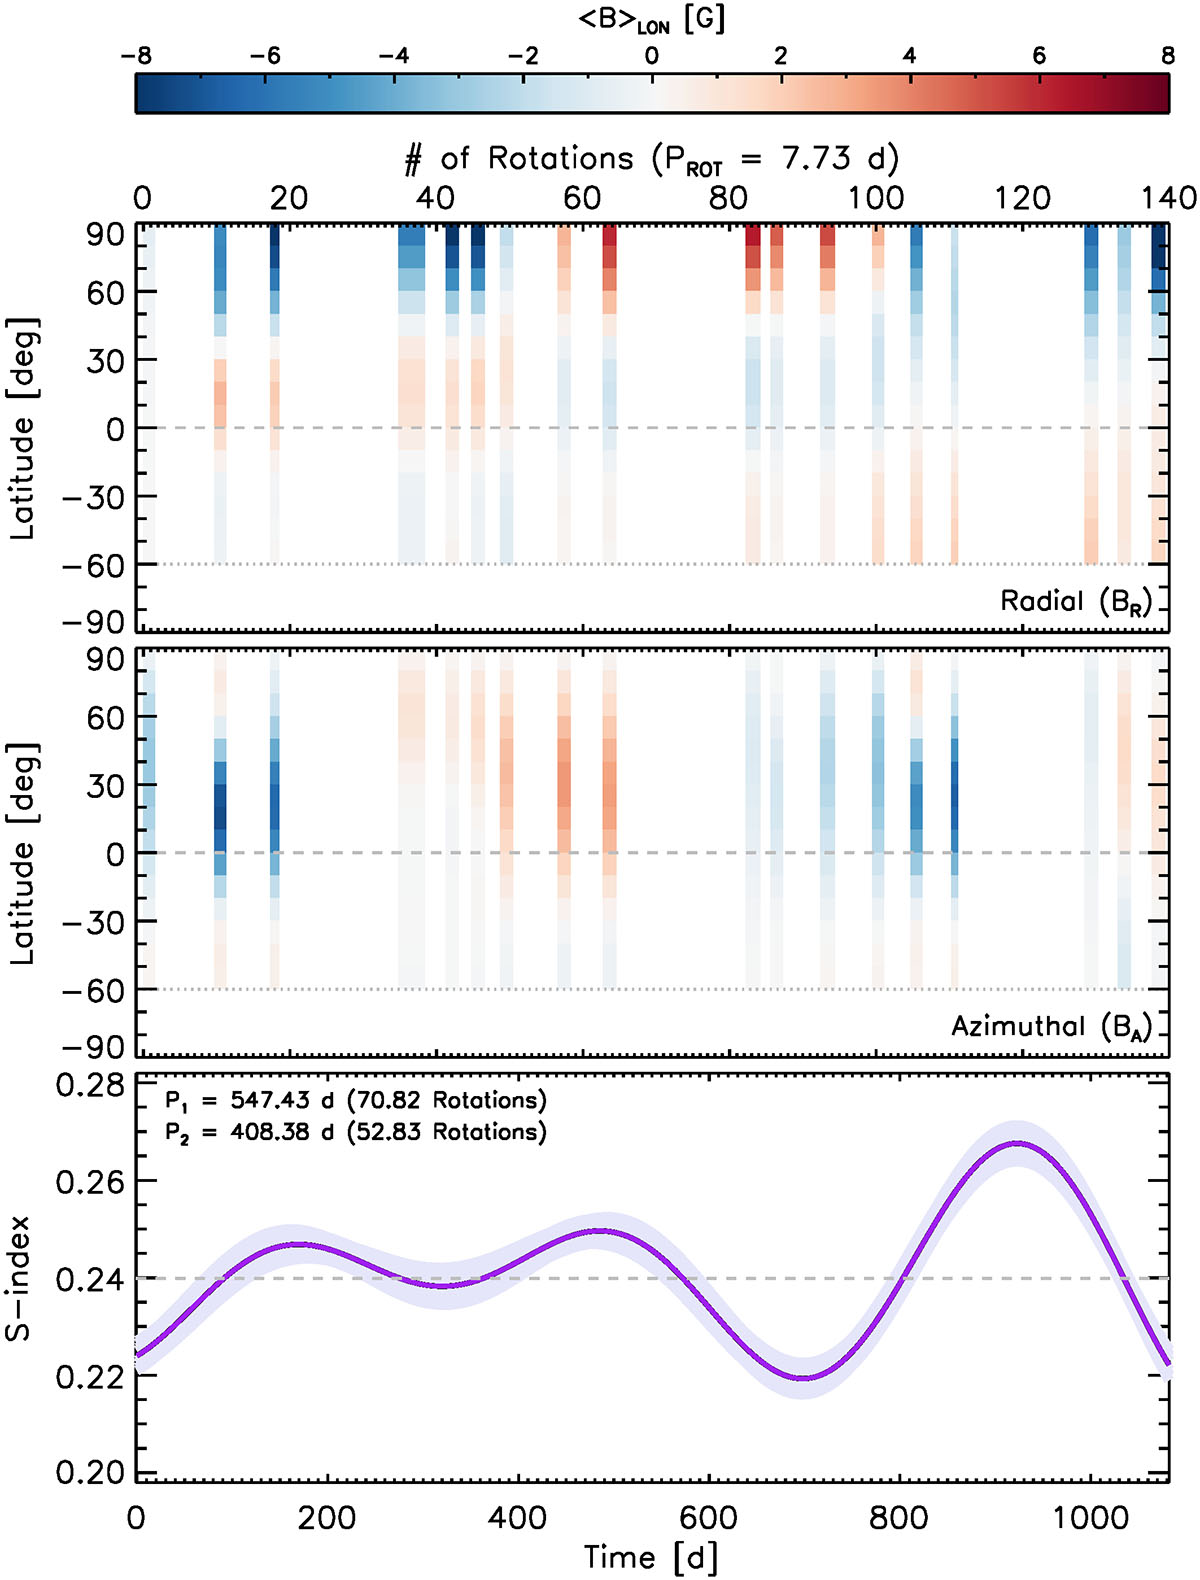
Top and middle: Butterfly diagrams of the radial (top) and azimuthal (middle) large-scale magnetic field of ι Hor. These synoptic maps display the longitudinally averaged magnetic field strength (color bar, in gauss), extracted over 10° latitudinal strips on the individual ZDI epochs (Figs. 1 to 3). Bottom: Best two-period fit to the Ca II H&K S-index variations obtained by Amazo-Gómez et al. (2023). The shaded region encapsulates the 1σ period and amplitude uncertainties. Day “0” corresponds to BJD = 2457300.78580 (2015-10-05 06:51:33.12 UTC), and a secondary x-axis indicates the number of stellar rotations covered by the campaign (assuming Prot = 7.73 d).
Current usage metrics show cumulative count of Article Views (full-text article views including HTML views, PDF and ePub downloads, according to the available data) and Abstracts Views on Vision4Press platform.
Data correspond to usage on the plateform after 2015. The current usage metrics is available 48-96 hours after online publication and is updated daily on week days.
Initial download of the metrics may take a while.