Fig. 8.
Download original image
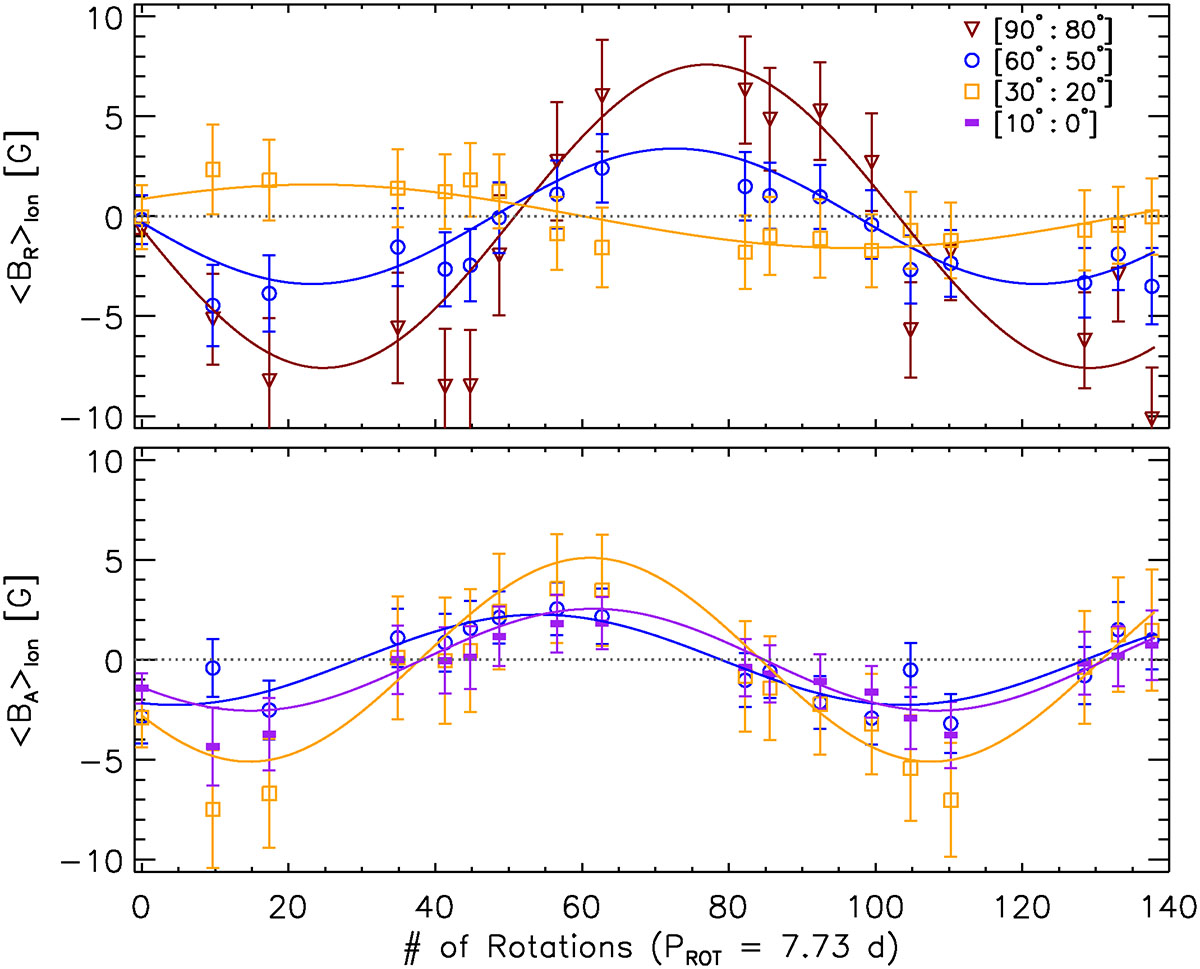
Temporal profiles of the longitudinally averaged radial (top) and azimuthal (bottom) large-scale magnetic field of ι Hor. Symbols and colors denote the range of latitudes of extraction, with error bars indicating the standard deviation of each component within the associated latitude strip as well as with longitude. Solid lines (with corresponding colors) show the resulting best-fit solution for a single-period model (three free parameters) at a given latitude bin (see text for details).
Current usage metrics show cumulative count of Article Views (full-text article views including HTML views, PDF and ePub downloads, according to the available data) and Abstracts Views on Vision4Press platform.
Data correspond to usage on the plateform after 2015. The current usage metrics is available 48-96 hours after online publication and is updated daily on week days.
Initial download of the metrics may take a while.