Fig. 1.
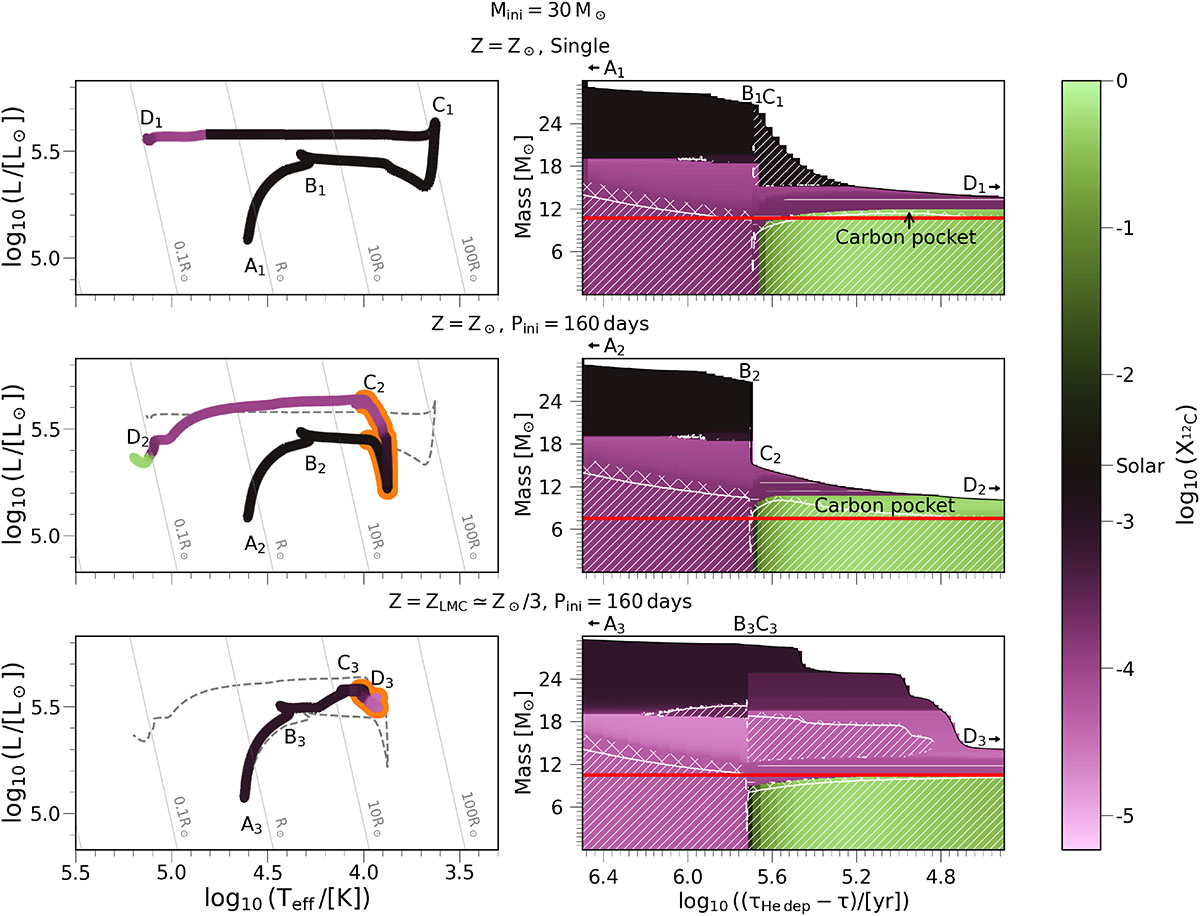
Download original image
Left: HR diagrams of a representative solar-metallicity single star (top row) and binary-stripped stars at solar metallicity (Z = 0.0142; middle row) and LMC metallicity (Z = 0.0047; bottom row) with the same initial mass (Mini) of 30 M⊙ until core helium depletion. The color of the tracks indicates the surface carbon mass fraction. Lines of constant radii are shown in gray, with the radii indicated. For binary-stripped stars, the mass transfer phase is highlighted as the orange bold “hook” feature of the track. For comparison, we also plot the track of solar-metallicity single star evolution as the dashed line in the middle row, and the track of a solar-metallicity binary-stripped star as the dashed line in the bottom row. Right: Same but for Kippenhahn diagrams. The color indicates the carbon mass fraction at each mass coordinate as a function of the evolutionary time (τ) before the helium depletion (τHe dep). Hatched regions show the convection and overshoot. The red horizontal line is the mass coordinate of the CO core at the end of helium depletion; the carbon-rich layer above this line is the carbon-rich pocket (as labeled) that eventually contributes to the carbon yields. The letters mark different evolutionary stages: core hydrogen burning initiation or ZAMS (A), core hydrogen depletion or TAMS (B), core helium burning initiation (C), and core helium depletion (D). Arrows near the letters indicate whether the corresponding evolutionary stages happen before or after the time included in the plot.
Current usage metrics show cumulative count of Article Views (full-text article views including HTML views, PDF and ePub downloads, according to the available data) and Abstracts Views on Vision4Press platform.
Data correspond to usage on the plateform after 2015. The current usage metrics is available 48-96 hours after online publication and is updated daily on week days.
Initial download of the metrics may take a while.