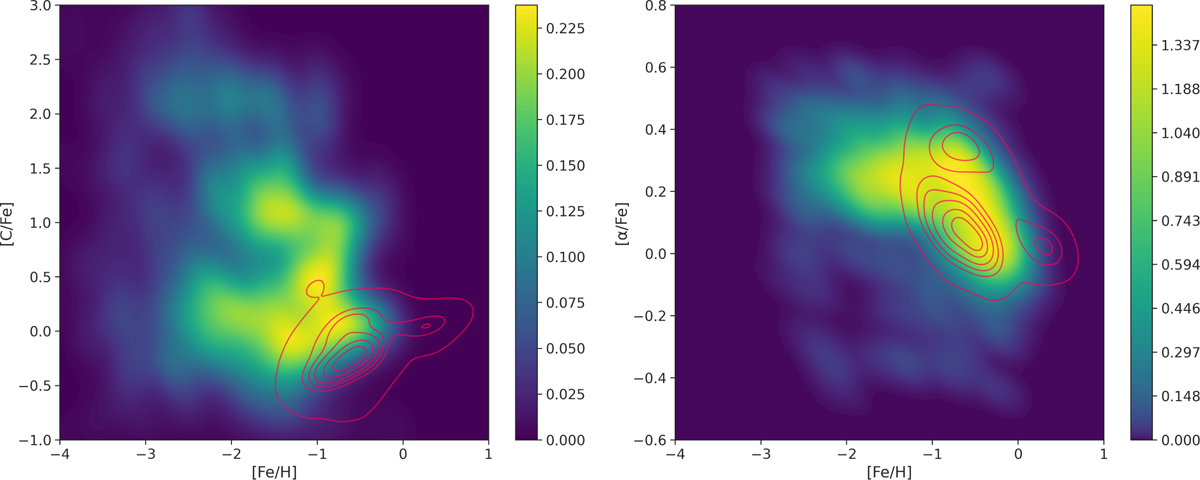
Fig. 2
Download original image
Abundance distributions for the simulated stellar sample. PDFs for the chemical abundances used to sample the stellar properties in our dataset, with lighter colors indicating higher probability densities. Left panel: PDF of [C/Fe] versus [Fe/H]. Right panel: PDF of [α/Fe] vs. [Fe/H]. In both panels, the pink contours show the abundance distributions of halo stars from the APOGEE survey, as provided by the astroNN catalog. APOGEE does not reach the lowest metallicities present in our simulated dataset, which explains the differences at low [Fe/H].
Current usage metrics show cumulative count of Article Views (full-text article views including HTML views, PDF and ePub downloads, according to the available data) and Abstracts Views on Vision4Press platform.
Data correspond to usage on the plateform after 2015. The current usage metrics is available 48-96 hours after online publication and is updated daily on week days.
Initial download of the metrics may take a while.