Fig. 4
Download original image
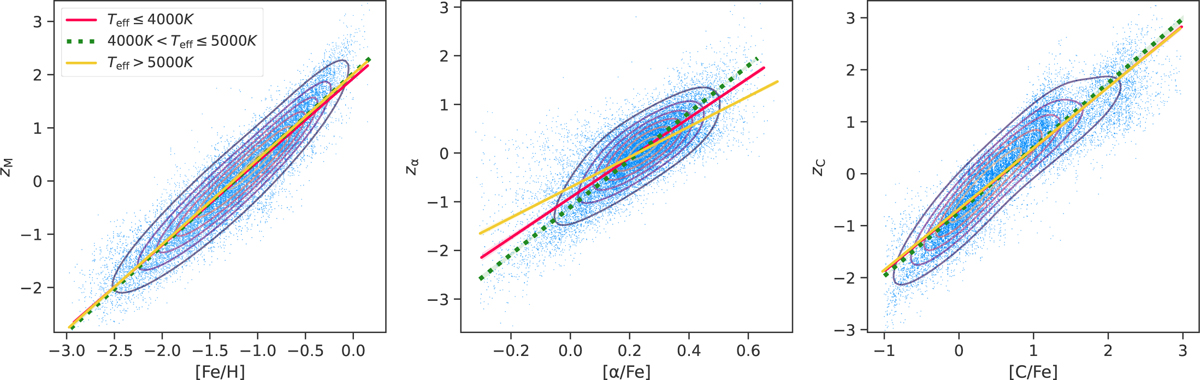
Latent-abundance relations for the learned representation. Contour plot of latent features (from left to right, zM, zα, zC) and their corresponding chemical abundances. The scatter points represent individual data points, and the contour lines represent data density, with lighter contours indicating regions of higher density. Straight lines show linear fits to the latent-abundance relations for stars in three Teff bins, as indicated in the legend.
Current usage metrics show cumulative count of Article Views (full-text article views including HTML views, PDF and ePub downloads, according to the available data) and Abstracts Views on Vision4Press platform.
Data correspond to usage on the plateform after 2015. The current usage metrics is available 48-96 hours after online publication and is updated daily on week days.
Initial download of the metrics may take a while.