Fig. 1
Download original image
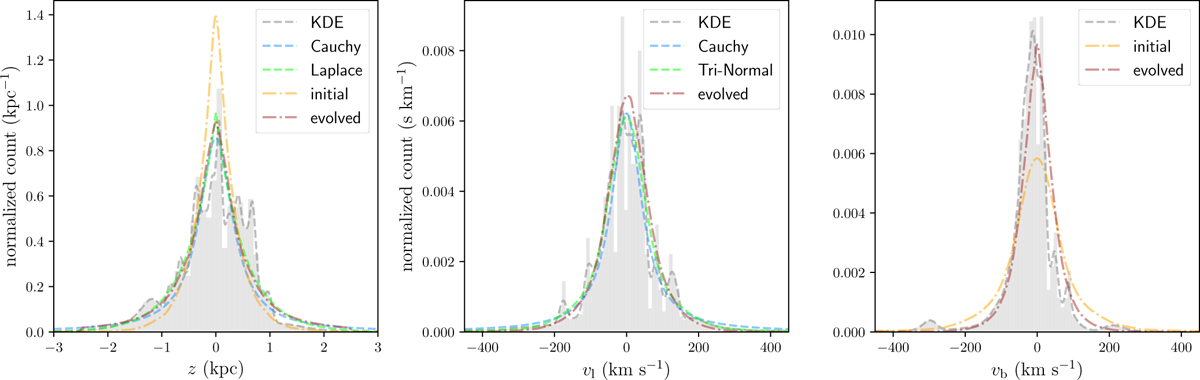
Histograms of Galactic heights, z; the Galactic-longitude component, v1; and the Galactic-latitude component, vb, of transverse peculiar velocities, respectively shown in the left, middle, and right panels. Each histogram is concatenated from 10000 simulations drawn from the assumed split normal distributions for the 64 measurements (of z, vl, or vb; see Table B.1). The dashed grey curves show the normalised count smoothed with kernel density estimation (using scipy.stats.Gaussian_kde). The best-fit Cauchy, Laplace and three-component normal distributions are plotted as dashed blue and green curves. The dynamical population synthesis results (labelled as ‘evolved’) that best match the observed z, v1 and vb, based on the determined initial MSP scale height of ζ0=0.32 kpc, are overlaid. The corresponding initial distributions are also provided, except for v1, as the initial v1 distribution adopted in the dynamical population synthesis is identical to the best-fit three-component normal distribution (a linear combination of three normal distributions).
Current usage metrics show cumulative count of Article Views (full-text article views including HTML views, PDF and ePub downloads, according to the available data) and Abstracts Views on Vision4Press platform.
Data correspond to usage on the plateform after 2015. The current usage metrics is available 48-96 hours after online publication and is updated daily on week days.
Initial download of the metrics may take a while.