Fig. 3
Download original image
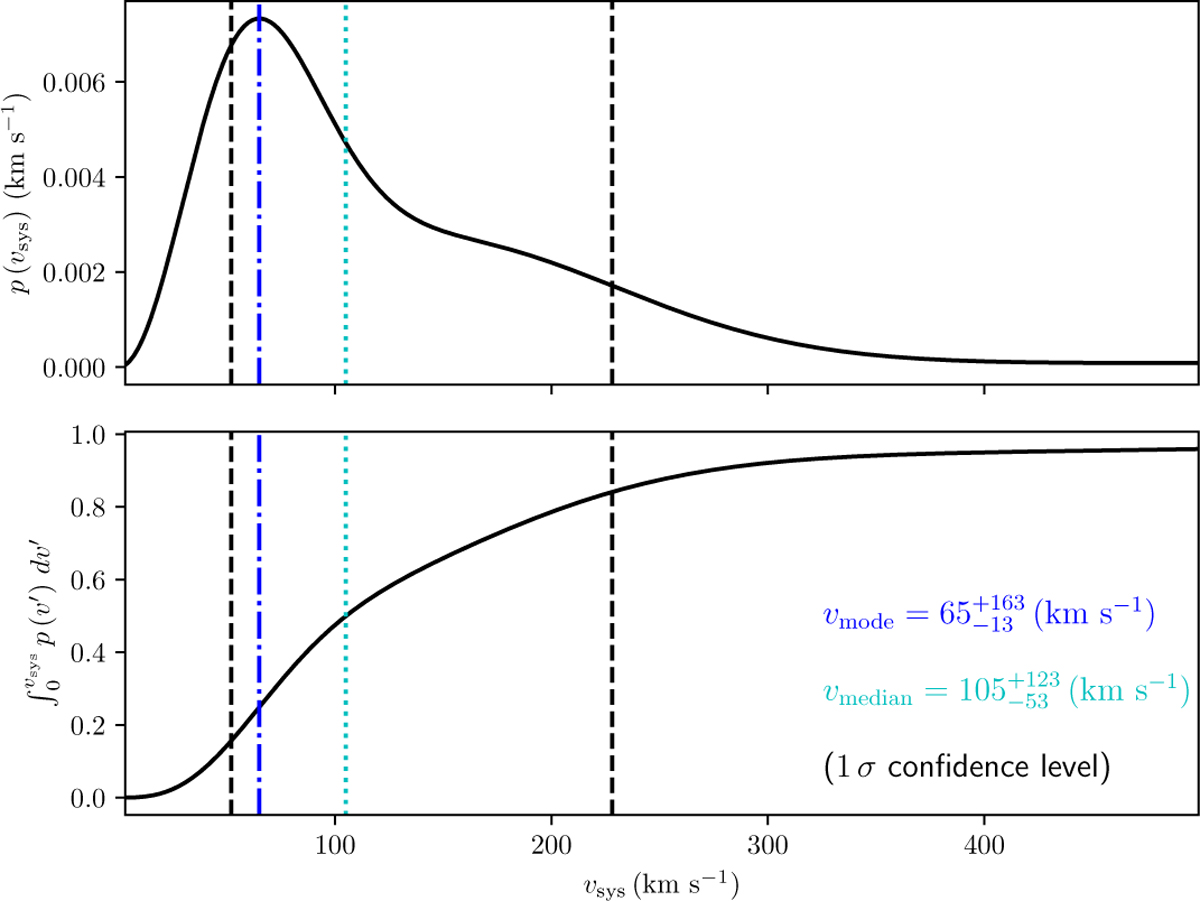
Top: three-component Maxwell distribution described by Equation (1), which shares the parameters of the best-fit three-component normal distribution (see Table C.1) of the observed v1 sample. Bottom: cumulative distribution function (CDF) calculated from the threecomponent Maxwell distribution shown in the upper panel. The vertical dash-dotted line marks the mode of the three-component Maxwell distribution, while the dashed lines and the dotted line correspond to the 16th, the 84th, and the 50th percentile of the CDF, respectively.
Current usage metrics show cumulative count of Article Views (full-text article views including HTML views, PDF and ePub downloads, according to the available data) and Abstracts Views on Vision4Press platform.
Data correspond to usage on the plateform after 2015. The current usage metrics is available 48-96 hours after online publication and is updated daily on week days.
Initial download of the metrics may take a while.