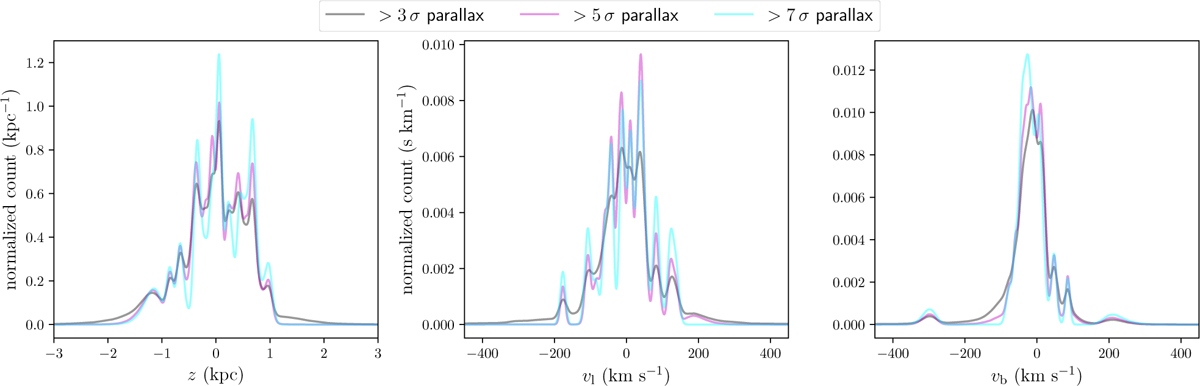
Fig. B.1
Download original image
Normalised histograms of Galactic heights, z, the Galactic-longitude component, vl, and the Galactic-latitude component, vb, of transverse peculiar velocities, shown, respectively, in the left, middle, and right panels. The normalised histograms have been smoothed with kernel density estimation (using scipy.stats.Gaussian_kde). Each histogram is concatenated from 10000 simulations drawn from the assumed split normal distributions for the measurements (of z, v1 or vb; see Table B.1). The black, magenta, and yellow curves correspond to the full sample (of 64 field MSPs) and two high-precision samples (see Appendix B), respectively.
Current usage metrics show cumulative count of Article Views (full-text article views including HTML views, PDF and ePub downloads, according to the available data) and Abstracts Views on Vision4Press platform.
Data correspond to usage on the plateform after 2015. The current usage metrics is available 48-96 hours after online publication and is updated daily on week days.
Initial download of the metrics may take a while.