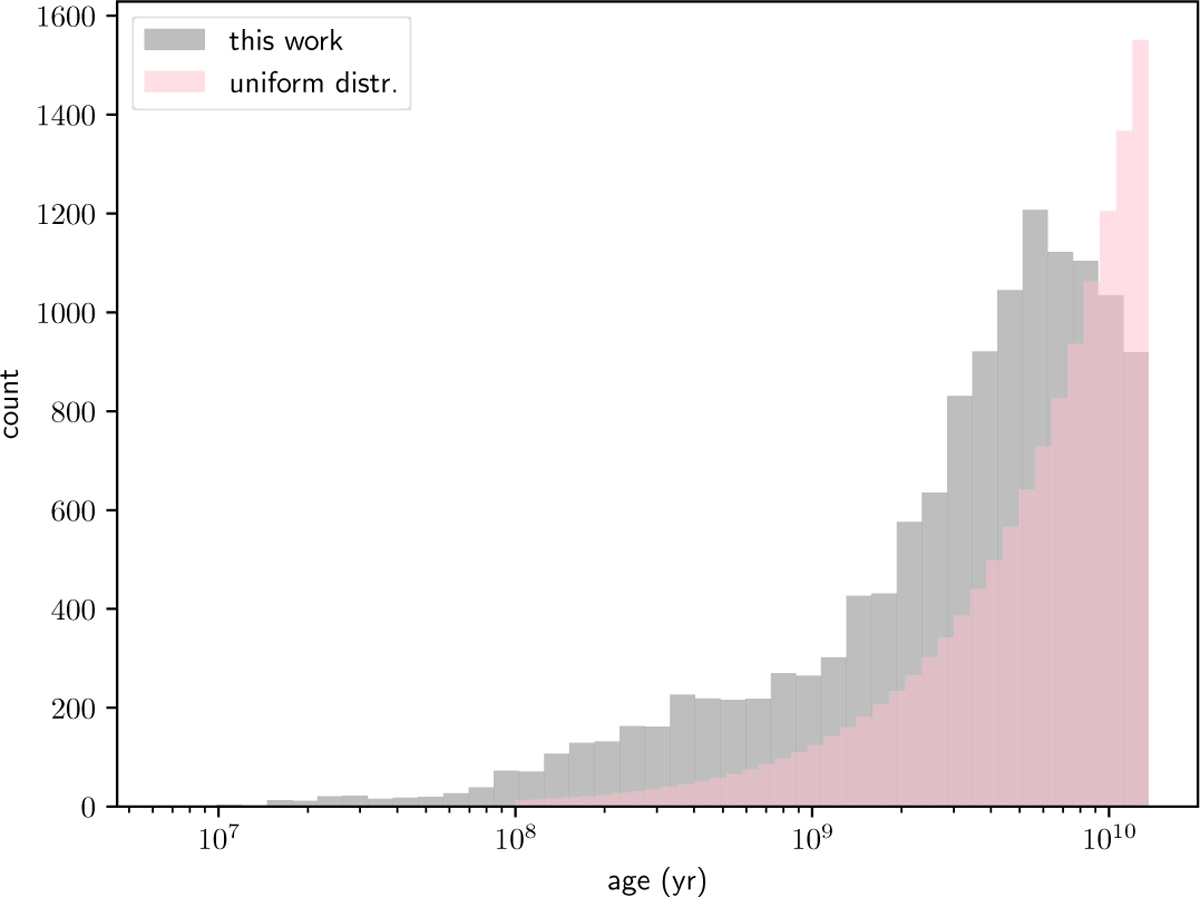
Fig. D.1
Download original image
Gray: Histogram of the millisecond pulsar age distribution adopted in DPS (see Appendix D.1), with logarithmically spaced bins along the x-axis; Pink: Uniform distribution 𝒰(0.1, 13.6)(Gyr) with logarithmically spaced bins along the x-axis, which is only used to examine the DPS robustness with respect to uncertainties in the MSP age distribution (see Appendix D.2).
Current usage metrics show cumulative count of Article Views (full-text article views including HTML views, PDF and ePub downloads, according to the available data) and Abstracts Views on Vision4Press platform.
Data correspond to usage on the plateform after 2015. The current usage metrics is available 48-96 hours after online publication and is updated daily on week days.
Initial download of the metrics may take a while.