Fig. 2.
Download original image
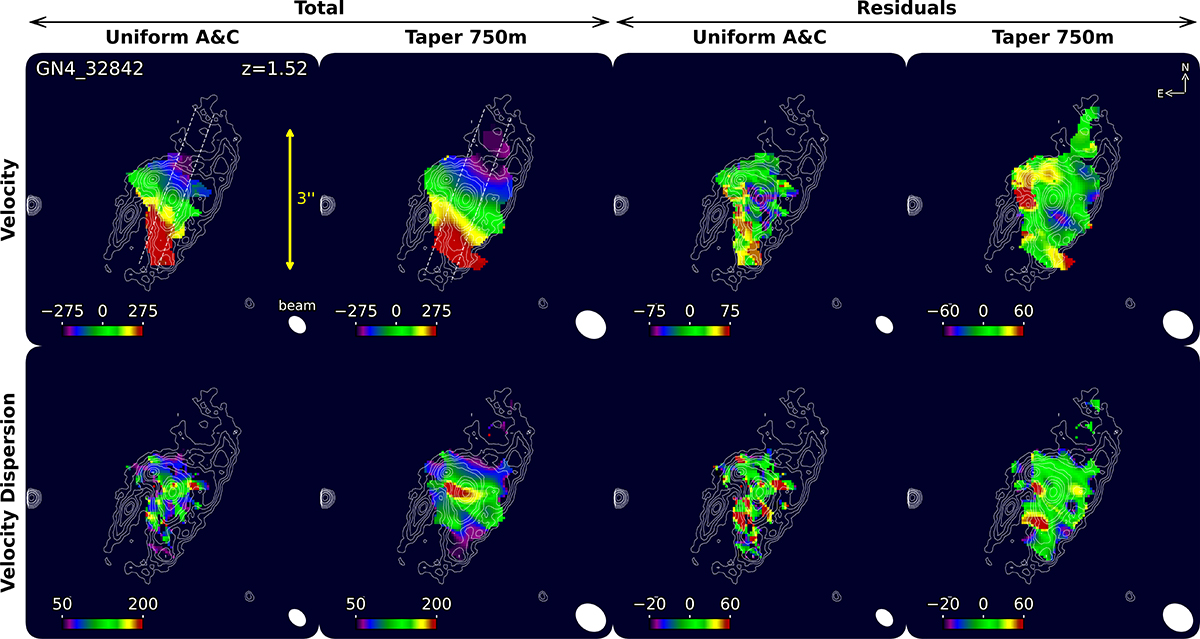
Observation: Total (first and second from left) and residual (third and fourth from left) velocity (top) and velocity dispersion (bottom) maps. The first and third columns from the left show the results for our uniformly weighted data (FWHM resolution 0![]() 36), while the maps in the second and fourth columns are derived from the tapered data (FWHM resolution 0
36), while the maps in the second and fourth columns are derived from the tapered data (FWHM resolution 0![]() 57). The color denotes the amplitude of the velocity and velocity dispersion, with the range for each plot given in the bottom left corner in km/s. In the higher resolution uniformly weighted data, a consistent pattern is observed in the velocity residuals with positive values on the eastern side and negative on the western one. This pattern is consistent with expected in-plane inflow and outflow patterns in the presence of a bar, namely, inflows on the leading and outflows on the trailing side of the bar due to gas streaming along quasi-elliptical streamlines. In the case of the tapered data, a good S/N is achieved in a more extended area, albeit at the expense of a lower spatial resolution with only the outflowing part of the in-plane streaming motions being observed along the minor axis.
57). The color denotes the amplitude of the velocity and velocity dispersion, with the range for each plot given in the bottom left corner in km/s. In the higher resolution uniformly weighted data, a consistent pattern is observed in the velocity residuals with positive values on the eastern side and negative on the western one. This pattern is consistent with expected in-plane inflow and outflow patterns in the presence of a bar, namely, inflows on the leading and outflows on the trailing side of the bar due to gas streaming along quasi-elliptical streamlines. In the case of the tapered data, a good S/N is achieved in a more extended area, albeit at the expense of a lower spatial resolution with only the outflowing part of the in-plane streaming motions being observed along the minor axis.
Current usage metrics show cumulative count of Article Views (full-text article views including HTML views, PDF and ePub downloads, according to the available data) and Abstracts Views on Vision4Press platform.
Data correspond to usage on the plateform after 2015. The current usage metrics is available 48-96 hours after online publication and is updated daily on week days.
Initial download of the metrics may take a while.