| Issue |
A&A
Volume 704, December 2025
|
|
|---|---|---|
| Article Number | A329 | |
| Number of page(s) | 20 | |
| Section | Extragalactic astronomy | |
| DOI | https://doi.org/10.1051/0004-6361/202555430 | |
| Published online | 19 December 2025 | |
NOEMA3D: A first kiloparsec resolution study of a z ∼ 1.5 main sequence barred galaxy channeling gas into a growing bulge
1
Max-Planck-Institut für Extraterrestrische Physik (MPE), Gießenbachstr. 1, D-85748 Garching, Germany
2
Max-Planck-Institut für Astrophysik (MPA), Karl-Schwarzschild-Str. 1, D-85748 Garching, Germany
3
Departments of Physics and Astronomy, University of California, Berkeley, CA 94720, USA
4
Institut de Radioastronomie Millimétrique (IRAM), 300 Rue de la Piscine, 38400 Saint-Martin-d’Hères, France
5
Universitäts-Sternwarte Ludwig-Maximilians-Universität (USM), Scheinerstr. 1, München D-81679, Germany
6
Observatoire de Paris, LERMA, CNRS, PSL Univ., Sorbonne University, UPMC, Paris, France
7
College de France, 11 Pl. Marcelin Berthelot, 75231 Paris, France
8
Technical University of Munich, TUM School of Natural Sciences, Physics Department, 85747 Garching, Germany
9
Observatorio Astronómico Nacional (OAN-IGN)-Observatorio de Madrid, Alfonso XII, 3, 28014 Madrid, Spain
10
Departamento de Astronomía, Universidad de Concepción, Barrio Universitario, Concepción, Chile
11
Millenium Nucleus for Galaxies (MINGAL), Concepción, Chile
12
Cosmic Dawn Center (DAWN), Copenhagen, Denmark
13
DTU-Space, Technical University of Denmark, Elektrovej 327, DK2800 Kgs. Lyngby, Denmark
14
Purple Mountain Observatory, Chinese Academy of Sciences, 10 Yuanhua Road, Nanjing 210023, China
15
School of Physics and Astronomy, Tel Aviv University, Tel Aviv, 69978 Israel
16
Scuola Normale Superiore, Piazza dei Cavalieri 7, I-56126 Pisa, Italy
17
Department of Physics and Astronomy and PITT PACC, University of Pittsburgh, Pittsburgh, PA 15260, USA
18
Osservatorio Astronomico di Padova, Vicolo dell’Osservatorio 5, Padova I-35122, Italy
19
Department of Physics and Astronomy “Augusto Righi”, University of Bologna, Via Piero Gobetti 93/2, 40129 Bologna, Italy
20
INAF – Astrophysics and Space Science Observatory of Bologna, Via Piero Gobetti 93/3, 40129 Bologna, Italy
21
Centre for Computational Astrophysics, Flatiron Institute, 162 5th Avenue, New York, NY 10010, USA
22
Department of Physics, University of Bath, Claverton Down, Bath BA2 7AY, UK
★ Corresponding author: This email address is being protected from spambots. You need JavaScript enabled to view it.
Received:
7
May
2025
Accepted:
5
September
2025
Abstract
We present a very deep CO(3–2) observation of a massive, gas-rich, main sequence, barred spiral galaxy at z ≈ 1.52. Our data were taken with the IRAM-NOEMA interferometer for a 12-antenna equivalent on-source integration time of ∼50 hours. We fit the major axis kinematics with the forward modeling of a rotating disk and subtracted the two-dimensional beam convolved best-fit model, which revealed signatures of planar noncircular motions in the residuals. The inferred in-plane radial velocities are remarkably high, of the order of ≈60 km/s. Direct comparisons with a high-resolution, simulated, gas-rich, barred galaxy, obtained with the moving mesh code AREPO and the TNG sub-grid model, show that the observed noncircular gas flows can be explained as radial flows driven by the central bar, with an inferred net inflow rate of the order of the star formation rate (SFR). Given the recent evidence for a higher-than-expected fraction of barred disk galaxies at cosmic noon, our results suggest that rapid gas inflows due to bars could be important evolutionary drivers for the dominant population of star-forming galaxies at the peak epoch of star and galaxy formation.
Key words: galaxies: evolution / galaxies: high-redshift / galaxies: kinematics and dynamics
© The Authors 2025
 Open Access article, published by EDP Sciences, under the terms of the Creative Commons Attribution License (https://creativecommons.org/licenses/by/4.0), which permits unrestricted use, distribution, and reproduction in any medium, provided the original work is properly cited.
This article is published in open access under the Subscribe to Open model.
Open access funding provided by Max Planck Society.
1. Introduction
Bars are ubiquitous structures observed in about two-thirds of local spiral galaxies (e.g., Eskridge et al. 2000; Menéndez-Delmestre et al. 2007; Simmons et al. 2014; Erwin 2018). They originate from the highly elongated x1 family of orbits (Contopoulos & Papayannopoulos 1980; Contopoulos & Grosbol 1989; Athanassoula 1992a; Skokos et al. 2002) which provide the orbital support for the bar. These structures can extend up to the corotation radius, namely, the radius at which the material of the disk rotates at the same angular velocity as the pattern (bar) (Contopoulos 1980).
The role of bars in the evolution of their host galaxies is profound, as they drive gas inflows toward the central regions (Roberts et al. 1979; Athanassoula 1992b; Sormani & Barnes 2019; Chown et al. 2019; Pastras et al. 2022; Yu et al. 2022; Sormani et al. 2023), promoting the formation of rings (Piner et al. 1995; Buta & Combes 1996; Maciejewski 2004a,b; Kim et al. 2012b,a; Sormani et al. 2024), building central gas reservoirs and nuclear disks, (Gadotti et al. 2015; Seo et al. 2019; Gadotti et al. 2020; Bittner et al. 2020; Schinnerer et al. 2023; Verwilghen et al. 2024; Fraser-McKelvie et al. 2025) and potentially fueling active galactic nuclei (AGN) (Shlosman et al. 1990; García-Burillo et al. 2005; Silva-Lima et al. 2022). They also contribute to the redistribution of angular momentum from the inner parts of the galactic disk toward its outer regions and the dark matter halo (Lynden-Bell & Kalnajs 1972; Sellwood 1981; Athanassoula 2002, 2003; Martinez-Valpuesta et al. 2006).
The large inflows driven by bars have been extensively studied from both theoretical and observational perspectives. It has been shown that in the presence of bars, gas forms narrow, high-density regions at the leading side of the bar, with respect to its rotation. These are the so-called dust (or bar) lanes, where shocks and negative torques cause gas to lose angular momentum and flow toward the central regions (Roberts et al. 1979; Athanassoula 1992b; Wada 1994; Patsis & Athanassoula 2000). These features have been observed in great detail in local barred galaxies (e.g,. Beckman et al. 2004; Stuber et al. 2023; Sormani et al. 2023) and their results, for example, the star formation history of nuclear disks, have been used to time the formation of bars themselves (Gadotti et al. 2015; de Sá-Freitas et al. 2023a,b, 2025).
Since the first studies of bar formation, it has been shown that bars arise naturally in dynamically cold, baryon-dominated disks as a consequence of an m = 2 (azimuthally bi-symmetric) instability (e.g., Hohl 1971; Ostriker & Peebles 1973; Combes & Sanders 1981; Efstathiou et al. 1982; Fujii et al. 2018; Fragkoudi et al. 2021; Bland-Hawthorn et al. 2023). The effects of the dark matter halo are instead contradictory; on one hand, it stabilizes the disk, while on the other it promotes the growth of existing bars through the absorption of angular momentum (Lynden-Bell & Kalnajs 1972; Sellwood 1981; Athanassoula 2002, 2003; Martinez-Valpuesta et al. 2006; Athanassoula et al. 2013; Sellwood 2016). Early studies on the effect of a gaseous component suggested that an increased gas fraction in the disk could delay (or even suppress) bar formation (Athanassoula et al. 2013). On the contrary, recent works on bar formation in baryon-dominated, turbulent, gas-rich disks indicate that a significant gas component can accelerate this process (Bland-Hawthorn et al. 2024). Finally, the effect of the environment on bars is two-fold, with tidal interactions and mergers being able to both trigger bar formation and destroy a pre-existing bar (e.g., Noguchi 1987; Miwa & Noguchi 1998; Gerin et al. 1990; Łokas et al. 2014; Łokas 2018; Peschken & Łokas 2019; Merrow et al. 2024; Rosas-Guevara et al. 2024; Zheng & Shen 2025; Fragkoudi et al. 2025; Zheng et al. 2025).
Turning to observations at the peak phase of star and galaxy formation (cosmic noon at z ∼ 1 − 3), early studies using the Hubble Space Telescope (HST) in the rest-frame UV/optical bands found a strongly decreasing fraction of disk galaxies being barred with increasing redshift (Madau et al. 1996; Abraham et al. 1999; Sheth et al. 2008; Lotz et al. 2008, 2011; Melvin et al. 2014; Madau & Dickinson 2014; Simmons et al. 2014; Margalef-Bentabol et al. 2022, however, also see Elmegreen et al. 2004; Jogee et al. 2004). More recent studies with the James Webb Space Telescope (JWST) probing the rest-frame near-infrared (NIR) continuum, have revealed a higher bar fraction (Le Conte et al. 2024; Guo et al. 2025; Géron et al. 2025; Espejo Salcedo et al. 2025), with the intrinsic value being possibly even higher due to observational effects (Liang et al. 2024). These observational results are supported by cosmological simulations (e.g., Fragkoudi et al. 2020; Zhao et al. 2020; Rosas-Guevara et al. 2022; Fragkoudi et al. 2025, however, also see Kraljic et al. 2012). Some exceptional cases of barred galaxies have also been reported at redshifts of z ≳ 4 (e.g., Smail et al. 2023; Tsukui et al. 2024; Amvrosiadis et al. 2025).
While the fraction of high-redshift barred disks seems to be significant, the properties of these galaxies differ from those of their local counterparts. Cosmic noon galaxies are more turbulent (Genzel et al. 2006; Förster Schreiber et al. 2009; Kassin et al. 2012; Swinbank et al. 2017; Übler et al. 2019; Wisnioski et al. 2019), gas-rich (Tacconi et al. 2018, 2020; Förster Schreiber & Wuyts 2020), and baryon-dominated showing evidence of inner dark matter cores (Wuyts et al. 2016b; Lang et al. 2017; Genzel et al. 2017, 2020; Price et al. 2021; Bouché et al. 2022; Puglisi et al. 2023; Nestor Shachar et al. 2023). The number of detailed studies investigating gas flows under these conditions remains limited. On the theoretical side, bar formation and evolution in turbulent gas-rich disks have been systematically studied recently with improved cold gas methods (Bland-Hawthorn et al. 2024). Observationally, highly resolved and sensitive kinematic data for barred galaxies at z > 1 remain scarce, due to the exceedingly long integration times required for typical main sequence targets, often of the order of tens of hours with state-of-the-art interferometers.
One notable example is that of a massive, main sequence, barred spiral at z ≈ 2.2, with both molecular (CO(4–3)) and ionized (Hα) gas observations, for which rapid inflows were identified along the bar (Genzel et al. 2023). Another case is that of a very massive z ≈ 2.5 barred galaxy with an inflow rate similar to the SFR (Huang et al. 2025). Further compelling cases include two dusty star-forming galaxies (DSFGs) at z > 3 with inflows identified on the leading side of the bar: one at z ≈ 3.1 located in the core of a protocluster (Umehata et al. 2025) and one lensed system at z ≈ 3.8 (Amvrosiadis et al. 2025). An additional example comes from a recent study revealing the effects of a bending wave in a barred spiral galaxy at z ≈ 4.4 (Tsukui et al. 2024).
With the role of bars in the secular evolution of high-z disks already established, albeit in a modest number of cases, an in-depth study of planar gas flows in a typical, main sequence, barred spiral at high redshift would offer valuable insights into the kinematics of a considerable fraction of the early galaxy population. It would also provide a way of testing theoretical predictions (see e.g., Bland-Hawthorn et al. 2024).
In this paper, we present a very deep IRAM-NOEMA CO(3–2) observation of a z ≈ 1.52, massive, main sequence, barred spiral galaxy in the Great Observatories Origins Deep Survey - North (GOODS-North) field. We obtain high-resolution kinematics down to kpc scales and measure the higher order motions following the methodology of Genzel et al. (2023). These are, in turn, associated with planar noncircular motions through the comparison with a simulation of a typical, gas-rich, star-forming galaxy at cosmic noon. In this way, we are able to assess the agreement between the inferred flow patterns and the theoretical predictions of our model as well as other works in the literature.
In Sect. 2, we present the observational data, fitting of the rotation and resulting line-of-sight (LOS) velocity residuals. In Sect. 3, we study the in-plane noncircular motions of our gas-rich barred galaxy simulation in detail, along with their expected LOS contributions. In Sect. 4, we compare these signatures with the observed residuals and discuss the implications of our results. Finally, in Sect. 5, we summarize our findings. Throughout this paper, we adopt the following typical cosmological parameters: H0 = 70 km/s/Mpc, Ωm = 0.3, and ΩΛ = 0.7.
2. Observation
2.1. Millimeter-Interferometer observation of a massive barred spiral at z ∼ 1.5
The galaxy targeted in this study is GN4_32842, a barred galaxy in the GOODS-North field. The CO(3–2) data have been taken with IRAM-NOEMA as part of the NOEMA3D survey targeting cosmic noon galaxies with a focus on their molecular gas kinematics (NOEMA3D Team et al., in prep.).
Our target was observed in the most extended (A) and intermediate (C) configurations for a 12-antenna equivalent on source integration time of ∼50 h1. The resulting data were calibrated and imaged using the radioastronomical software GILDAS2 (Gildas Team 2013). The data reduction process will be presented in detail in an upcoming paper (NOEMA3D Team et al., in prep.). Two data products were produced from our NOEMA visibilities: i) using uniform weighting achieving a spatial resolution of 0 36 and ii) using UV-tapering to increase the recovery of the extended emission, albeit at the cost of the lower resolution of 0
 57. In both cases the spectral resolution was set to 43.75 km/s (from a native 9 km/s) to maximize the signal-to-noise ratio (S/N), while still allowing sufficient precision in the line velocity. Since each of these data products offers different advantages, we used both of them in our analysis.
GN4_32842 has also been observed with HST in the context of the Cosmic Assembly Near-infrared Deep Extragalactic Legacy Survey (CANDELS) survey (Grogin et al. 2011; Koekemoer et al. 2011; van der Wel et al. 2012), as well as with JWST as part of the JWST Advanced Deep Extragalactic Survey (JADES, Proposal ID: 1181, PI: Eisenstein, Eisenstein et al. 2023). In the case of the latter, we retrieved high quality data from the DAWN JWST Archive (DJA), reduced using the Grizli3 pipeline (Brammer 2023). An imaging overview of our galaxy in various wavelengths, with both HST and JWST, as well as the integrated NOEMA CO(3–2) flux, is presented in Fig. 1.
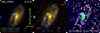 |
Fig. 1. Observation: Color composite of the JWST NIRCam 0.7–4.4 μm imaging data (left), combined HST V+J+H continuum (middle) and the CO(3–2) integrated line flux from our uniformly weighted NOEMA data overlaid with contours of the smooth-subtracted HST continuum bringing out the bar and spiral structure more prominently (right). In both HST and JWST images, a bar is observed in the form of an elongated structure in the central region of our galaxy. In the outskirts of the disk, the seemingly two-armed spiral pattern observed by HST becomes three-armed with JWST. The CO(3–2) flux is mostly concentrated in the bar region and extends beyond the ends of the bar into the spiral arms region. |
The combination of the deep molecular gas observation from NOEMA and the stellar continuum from the HST and JWST space telescopes allows us to probe the detailed gas kinematics and correlate them with galactic structure; in this case, we focused on the bar. To that end, we followed the methodology presented in Genzel et al. (2023) of fitting the circular rotation of the galaxy using forward modeling and subtracting the model from the observed velocity field to retrieve the kinematic residuals, which were then analyzed to identify and study possible second-order, noncircular motions.
2.2. Molecular gas kinematics and morphological overview
We started by fitting each spaxel of our data cubes with a single Gaussian component, imposing a S/N threshold and visually inspecting the fitting results confirming the quality of the fits and the absence of possibly significant secondary components. The resulting velocity and velocity dispersion fields for both of our data products are presented in the first two columns of Fig. 2.
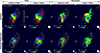 |
Fig. 2. Observation: Total (first and second from left) and residual (third and fourth from left) velocity (top) and velocity dispersion (bottom) maps. The first and third columns from the left show the results for our uniformly weighted data (FWHM resolution 0 |


Following Genzel et al. (2023), we carefully determined the position angle (PA) of the galaxy taking into account the following: i) the distribution of the observed optical and NIR continuum through a visual inspection and the elliptical isophote fitting analysis presented in Appendix A; ii) the line-of-nodes of our velocity field which is expected to align with the major axis; and iii) the zero-velocity region, expected to be perpendicular to the major axis. Since strong noncircular motions can significantly affect the observed velocity field, we put emphasis on the photometric data, while acknowledging that the observed stellar continuum can also be distorted by the presence of spiral arms or rings. We started with the PA derived through isophotal fitting and iteratively repeated the rest of our analysis, eventually converging to PA ≈ −20°. The inclination was constrained through the modeling of the major axis kinematics, presented in Sect. 2.3, with a prior centered on the value constrained by isophote fitting, resulting in i ≈ 49°. Following the convention presented in Appendix E, the effective inclination of the galaxy is i ≈ 131°.
The direction of rotation on the sky was determined using the direction the spiral arms are unfolding toward. Since spirals have been shown to be trailing both in normal (Contopoulos 1971; Toomre 1981) and barred spirals (Romero-Gómez et al. 2006, 2007; Athanassoula 2012; Patsis 2006), we conclude that our galaxy rotates clockwise in the sky plane. Consequently, given that its northwestern part is approaching, while the southeastern is receding (see Fig. 2), the galaxy is oriented similarly to the alignment seen in the top row of Figure 3 of Genzel et al. (2023), with its southwestern side closer to the observer (near side) than the northeastern one (far side).
We further constrained the observed PA of the bar to be PAbar ≈ −10° through elliptical isophote fitting, as presented in detail in Appendix A. This information is particularly useful for the interpretation of any observed velocity residuals. With the same analysis and the formulation presented in Appendix D, we estimated the projected semimajor axis of the bar to be SMAbar, proj ≈ 0 5. This result is at the high end of the relevant distribution for z ∼ 1 − 2 barred galaxies presented in Guo et al. (2025), corresponding to an in-plane value of SMAbar ≈ 4.5 kpc.
2.3. Dynamical forward modeling; unveiling the signatures of noncircular motions
We used the dynamical modeling tool DYSMAL (Davies et al. 2004a,b; Cresci et al. 2009; Davies et al. 2011; Wuyts et al. 2016b; Lang et al. 2017; Genzel et al. 2017; Übler et al. 2018), the predecessor of the recently released tool DysmalPy4 (Davies et al. 2004a,b; Cresci et al. 2009; Davies et al. 2011; Wuyts et al. 2016b; Lang et al. 2017; Price et al. 2021; Lee et al. 2025), to fit the major axis kinematics of our galaxy. As shown by Price et al. (2021), the mass distribution can be well constrained this way, since most of the rotational information is encoded along the major axis. The contribution of radial motions is expected to be minimal in this region, in contrast to the rest of the observed velocity field (van der Kruit & Allen 1978; Genzel et al. 2023), further strengthening the reliability of this method. However, noncircular tangential or vertical motions can contribute to the LOS velocities along the major axis (see Appendix E.4.2).
We extracted the kinematics (velocities and velocity dispersion from Gaussian fits) using a pseudo-slit with apertures of size ≈0.5× FWHM of the beam and fit it using DYSMAL. We used a model consisting of a spherical bulge following a Sérsic profile with a Sérsic index ns, bulge = 4 and a disk that is a flattened spheroid (Noordermeer 2008) with a vertical to radial axes ratio of q0, disk ≈ 0.2, embedded in an NFW dark matter halo (Navarro et al. 1996). We assumed a constant, isotropic velocity dispersion profile for the disk.
We fit the total baryonic mass, log(Mbaryons/M⊙), bulge to total ratio, B/T, effective radius of the disk, Re, dark matter fraction within this effective radius, fDM(< Re), velocity dispersion of the disk material, σ0, disk inclination, i, and the dynamical center. Following Genzel et al. (2023), for our priors, we took the sum of the extinction-corrected stellar mass and the molecular mass of the gas (Tacconi et al. 2020) for the total baryonic mass, log(Mbaryons/M⊙), the photometrically derived inclination for the inclination, i, and for the dynamical center a combination of the centroid of the CO velocity dispersion, the symmetry center of the systemic CO velocity, and (since it is well-defined for our target) the center of the extinction-corrected stellar distribution. With respect to the disk effective radius, Re, as a starting point, we used the effective radius of the large-scale optical emission and the FWHM of the CO emission along the major axis.
At each iteration of the fitting process, a mass model is realized and a 4D hypercube is produced and then collapsed along the LOS. It is subsequently convolved with the point-spread function (PSF) and line-spread function (LSF) of our observation, yielding a 3D model cube (see details in Price et al. 2021; Lee et al. 2025). The kinematics information is extracted from this model cube using the same method applied to the observational data and compared to the latter. The properties of the resulting best-fit model are presented in Table 1, while the respective flux, velocity, and velocity dispersion profiles along the major kinematic axis are shown in Fig. 3. We extracted the model velocity and velocity dispersion maps, through a pixel-by-pixel Gaussian fitting of the model cube, in the same manner as for the data cubes. Finally, we subtracted these velocity and velocity dispersion maps from the observed ones, revealing the residuals presented in the two right columns of Fig. 2.
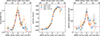 |
Fig. 3. Observation: Integrated CO(3–2) line intensity (left), velocity (middle) and velocity dispersion (right) profiles along the major axis of GN4_32842. The observed values marked with blue circles (orange squares) are extracted from our tapered (uniformly weighted) data product with a spatial resolution of 0 |


Observation: Properties of GN4_32842.
Since errors in the assumed orientation can introduce artifacts in the residual maps (e.g., Warner et al. 1973; van der Kruit & Allen 1978; Kolcu et al. 2023), we verified the robustness of our results by varying the PA and inclination by ±5° and repeating our analysis, recovering patterns that are in good agreement with those presented in Fig. 2.
2.4. Observational summary for GN4_32842
In summary, our results for GN4_32842 are as follows:
-
Our source is a massive galaxy with a dynamically inferred baryonic content of log(Mbaryons/M⊙)≈11.3 and a bulge to total ratio B/T ≈ 0.09. It hosts an extended, turbulent, gas-rich disk with an effective radius of Re ≈ 7.5 kpc, an intrinsic velocity dispersion of σ0 ≈ 48 km/s, and a gas fraction of fgas = Mgas/(Mgas + M★)≈ 26%. This disk is marginally stable (Behrendt et al. 2015), with a gas Toomre Q parameter of Qgas ∼ 0.69, estimated following Genzel et al. (2014). It is forming stars at a rate of SFR ≈ 106.6 M⊙/yr. Thus, it is a typical, massive, main sequence, cosmic noon galaxy.
-
A peak is observed in the velocity dispersion maps at the central regions, as expected due to beam smearing. This peak, along with a prominent bulge in the reddest NIRCam filter (F444W) that probes the rest-frame NIR continuum, was used for the reliable centering of our data cubes. A bar, in the form of an elongated stellar structure, is also clearly visible in the NIRCam images, at a position angle of PAbar ≈ -10°, while the major axis of the galaxy is found at PA ≈ -20°. The projected semimajor axis of the bar is SMAbar, proj≈ 0
 5, corresponding to an in-plane value of SMAbar ≈ 4.5 kpc. Beyond this radius, a prominent three-armed spiral structure is observed.
 -
The velocity fields in both data products show clearly a rotation pattern. However, there are distortions which become most apparent in our highest resolution data, providing evidence of deviations from purely circular motions. After the subtraction of our best-fit model, which (by construction) only features circular (plus local random) motions, we identify a pattern in the residual velocity maps; namely, there are positive residuals in the eastern side and negative in the western side of the galaxy. Interpreting these residuals as radial streaming motions, we inferred an in-plane inflow-outflow pattern of typical gas flows along quasi-elliptical streamlines in the presence of a bar (Roberts et al. 1979; Athanassoula 1992b). In our tapered data, only the outflowing part of these in-plane streaming motions is observed.
-
An estimation of the amplitude of these radial streaming motions yields vr(in-plane)≈60 ± 13 km/s. This inferred planar radial velocity is significantly higher than the expected azimuthally averaged inflow velocities vr(Toomre) due to global disk instability and angular momentum transport through dynamical friction and gravitational torques. An estimation of the latter following the Genzel et al. (2023) formulation (Eq. 11 with α, ζ, and γ for axisymmetric flow, average between Krumholz & Burkert 2010 and Krumholz et al. 2018) and using the observed fgas, vc, and σ0 results in a ratio vr(in-plane)/vr(Toomre)≈2.7.
We conclude that the observed second-order motions are significant and exceed the estimated predictions for axisymmetric inflows in gravitationally unstable disks. Additionally, their patterns, which are reminiscent of gas streaming in the presence of a bar, along with a prominent elongated structure in the rest-frame NIR continuum, imply that these motions are the effects of bar-driven nonaxisymmetric gas flows.
3. Simulation of a gas-rich disk
With our observational results in hand, we ran a high-resolution simulation of a typical, massive, cosmic noon galaxy in isolation and used a snapshot in which a prominent bar has formed to constrain the nature of the observed residual patterns and associate them with in-plane noncircular motions.
3.1. Initial conditions
Our initial conditions comprise a system of a disk, bulge, dark matter halo, and hot gaseous halo in dynamical equilibrium, realized with the use of MakeDiskGalaxy (Springel & White 1999; Springel et al. 2005) that was modified for the inclusion of a hot gaseous halo component by Moster et al. (2011, 2012). The properties of these components were determined based on those of GN4_32842 in addition to median parameters from studies of massive, star-forming galaxies at z ∼ 0.6 − 2.6 (Wisnioski et al. 2019; Nestor Shachar et al. 2023). The hot halo component was added with a view to provide, through cooling, a continuous supply of gas to the disk increasing the time during which the simulated galaxy remains gas-rich. In Appendix B, we present in detail the process of generating our initial conditions. In summary, our isolated system consists of:
-
a disk with a total mass of Mdisk = 1.25 × 10¹¹ M⊙ and an initial gas fraction of 20%, split into two thick exponential components, each with a scale height over scale length ratio of q0, disk = 0.2:
-
a stellar one with Mdisk, ★ = 1011 M⊙ and an effective radius of Reff, disk, ★ ≈ 5 kpc;
-
a gaseous one with Mdisk, gas = 2.5 × 10¹⁰ M⊙, an effective radius of Reff, disk, gas = 2Reff, disk, ★ and solar metallicity.
-
-
a spherical Hernquist Mbulge = 1010 M⊙ bulge with a projected effective radius of Reff, bulge, proj ≈ 1 kpc.
-
a Hernquist DM halo with a virial mass of MDM = 1012 M⊙, a concentration parameter c = 4.5, and a spin parameter of λ = 0.05.
-
a hot gaseous halo following a β-profile (Moster et al. 2011, 2012) with an outer slope parameter of β = 2/3, a core radius Rc, hot halo = 0.22 × Rs, with Rs being the equivalent NFW scale length of our dark matter halo profile, a total mass such that the baryon fraction within the virial radius is fbaryons≈ 24% (see Appendix B.3), an angular momentum ratio of α ≈ 2, and a metallicity of one-third solar.
The disk in our initial conditions is bar unstable. This conclusion is corroborated by both the ELN criterion (Efstathiou et al. 1982), with a value of RELN ≈ 0.89 indicating bar instability (however, see Athanassoula 2008; Izquierdo-Villalba et al. 2022; Romeo et al. 2023; Bland-Hawthorn et al. 2023; Ghosh et al. 2023), and the inner disk fraction criterion, given our initial disk fraction of fdisk(< 2.2Rd)≈0.54 (Widrow et al. 2008; Fujii et al. 2018; Bland-Hawthorn et al. 2023, 2024).
3.2. Simulation methods and overview
We ran our simulation using the moving mesh code AREPO (Springel 2010; Weinberger et al. 2020) and the TNG sub-grid model (Pillepich et al. 2018; Weinberger et al. 2017). Since our simulated galaxy hosts a massive, gas-rich disk, the initial Toomre Q values are low (Q ≈ 0.9–1.2 within ≈2Reff, disk, ★) hence a number of clumps is expected to form. The migration of these clumps toward the center is expected to heat the disk, inhibiting bar formation (Athanassoula & Sellwood 1986). While the imaging of GN4_32842 shows evidence of a clumpy morphology, the most striking feature is the bar structure. Thus, in order to suppress clump formation and enable the growth of a bar instability, we made an ad-hoc modification to the TNG sub-grid model by increasing the specific energy of the winds (see Naab & Ostriker (2017) for a review of different implementations). Specifically, we adopted the value  for the corresponding dimensionless parameter
  described in Section 2.3.2 of Pillepich et al. (2018) (see also Rosas-Guevara et al. 2025), namely, three times larger than the fiducial TNG model. We also modified the Galaxy Formation Module (GFM) pre-enrichment routines to allow for the introduction of different metallicities: solar and one-third solar, for the gaseous disk and hot halo, respectively (see Appendix B).
The mass resolution of our model is Mres, baryons ∼ 105 M⊙ and Mres, DM ∼ 106 M⊙ for the baryons and dark matter, respectively. With respect to physical resolution, the softening length has been set to 50 pc for all collisionless particles with the minimum and median size of the star-forming gas cells being ∼5 pc and ∼70 pc, respectively.
Our simulated galaxy develops a bar within ≈800 Myr. The time of bar formation was identified through the use of the threshold for the normalized amplitude of the m = 2 Fourier mode of the face-on stellar surface density Im = 2/I0 > 0.2, routinely used in the literature (e.g., Fujii et al. 2018; Fragkoudi et al. 2020, 2021; Rosas-Guevara et al. 2022, 2024).
The integrated cold gas fraction of the disk, namely, the fraction of the star-forming gas over the total disk mass fgas = MSF gas/(Mstars + MSF gas) within 5Re, remains almost constant at approximately 20%. This is achieved through the replenishment of the cold gas supply consumed by star formation through the cooling of the hot halo gas, as well as the smooth evolution of the SFR, with an approximately constant value of ≈50 M⊙/yr, without any initial starburst that would promptly deplete the gas reservoir of the galaxy (and significantly reduce the gas fraction as a result). Thus, bar formation takes place in a gas-rich disk providing a suitable analog to our observed z ≈ 1.52 barred spiral.
3.3. In-plane bar-driven gas flows
In this section, we study the morphology and in-plane gas flows in a showcase snapshot of our gas-rich barred spiral reminiscent of GN4_32842, approximately t ∼ 1 Gyr after the start of the simulation.
We first determined the center of the galaxy using the shrinking sphere method (Power et al. 2003) on the innermost stellar particles and oriented the disk face-on with the bar along the vertical y-axis using the eigenvectors of the reduced inertia tensor. An overview of our face-on simulated galaxy is presented in Fig. 4.
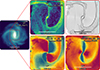 |
Fig. 4. Simulation: Face-on surface density of the stellar component (left) and the cold gas surface density (top middle), in-plane velocity field (top right), amplitude of radial (bottom middle), and tangential (bottom right) velocities. The bar is clearly discernible as an elongated structure in the stellar component, while two narrow regions of increased gas surface density, i.e., dust lane shocks or bar lanes, are located at the leading side of the bar. The identified gas flows in this gas-rich barred galaxy are in agreement with theoretical expectations; gas gets shocked at the loci of the bar lanes formed ahead, with respect to the direction of rotation, of the potential minimum, i.e., the major axis of the bar, loses angular momentum and gets funneled toward the center of the galaxy. This pattern is reflected in the radial and tangential components of the in-plane velocities, with a characteristic quadrupole pattern in the former and slower (faster) rotation along the major (minor) axis of the bar in the latter. |
The barred morphology is prominent in the stellar component with spiral arms emanating from the ends of the bar. We quantitatively assessed the morphological features using the Fourier decomposition of the face-on stellar surface density. All snapshots within |Δt|≤50 Myr from our showcase one were decomposed with the median normalized mode amplitude profiles and corresponding standard deviations presented in the right panel of Fig. 5, next to a projection of the stellar mass distribution on the sky plane (see Sect. 3.4 for more details). We find a consistent dominance of the m = 2 mode in the central region, highlighting the presence of the bar. The small scatter in the normalized m = 2 and m = 4 terms show evidence of an established morphology with little time variation in this region, the upper bound of which provides an estimate for the length of the bar, with its semimajor axis estimated at abar ≈ 3 kpc. A similar length is derived using the radius at which the normalized m = 2 amplitude falls below 70% of its maximum value (Fragkoudi et al. 2025). Moving outwards, a region of m = 3 dominance is found, in agreement with the three-fold asymmetry observed in GN4_32842, giving additional confidence in the comparison with our simulated barred spiral. It is also worth highlighting the increased m = 1 amplitude in the outskirts of our disk. This lopsidedness in the outer disks has been connected with gas accretion (Bournaud et al. 2005; Jog & Combes 2009), in this case from the hot halo, with m = 1 shown to be the most efficient mode for outwards angular momentum transport at large radii (Saha & Jog 2014).
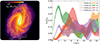 |
Fig. 5. Simulation: Projected stellar surface density of our simulation oriented similarly as GN4_32842 (left) and Fourier amplitudes of the stellar mass surface density in the face-on orientation (right). In the stellar surface density plot the overlaid contours trace the projected cold gas distribution and the scalebar indicates the size of 1 |

Turning to the gaseous component, we find an increased surface density in two narrow lanes at the leading sides of the bar (i.e., the dust lanes or bar lanes), in agreement with expectations for the gas distribution in a barred galaxy, from both a theoretical (e.g., Roberts et al. 1979; Athanassoula 1992b; Wada 1994; Patsis & Athanassoula 2000; Pastras et al. 2022) and an observational (e.g., Stuber et al. 2023; Sormani et al. 2023) standpoint.
The dust lanes have been shown to be the loci of strong shocks leading to the compression of gas, loss of angular momentum and inflows toward the central regions (e.g., Roberts et al. 1979; Athanassoula 1992b; Patsis & Athanassoula 2000; Pastras et al. 2022). In a frame corotating with the bar, gas streams into the bar lanes, gets shocked and subsequently funneled parallel to them toward the center. The gas that overshoots the central region, now at the trailing side of the bar, temporarily moves to larger radii, before streaming into the shock on the other side of the bar. Indeed, in our case, a closer examination of the velocity field in the bar region, in a nonrotating frame of reference, shown at the top right plot of Fig. 4, reveals such typical patterns of bar flows.
The features of the established flow pattern become still clearer when we consider the radial and tangential components of the in-plane velocities separately. In the tangential direction, the regular, axisymmetric rotation is distorted by the more slowly rotating pattern (bar) resulting in reduced rotational velocities in the region closer to its semimajor axis and increased in the region of the minor axis. This effect is further amplified by the presence of the dust lane shocks, the morphology of which becomes straighter with an increasing bar strength (Athanassoula 1992b), causing significant distortions in the tangential velocities, many times higher than the effective sound speed of the gas (Athanassoula 1992b; Pastras et al. 2022).
In the radial direction, we find an apparent inflow-outflow pattern, with negative radial velocities at the leading side of the bar’s major axis – with respect to the direction of rotation – and positive at the trailing side. The amplitude of the radial flows is of the order of ∼100 km/s in the regions of both inflows and outflows, with a consistently increased gas surface density at the former, especially along the bar lanes. This characteristic quadrupole shape has also been identified in high-resolution simulations of gas-rich, barred galaxies, in which the streams along the bar are in contact along its major axis forming a distinct pattern, which is described as a “radial shear flow” (Bland-Hawthorn et al. 2024).
We have shown that the emerging gas velocity fields in our simulated gas-rich disk are the result of the dynamics of the bar, with strong nonaxisymmetric streaming motions identified in its region. An estimation of the net radial flow resulting from these gas streams yields a net inflow rate of the order of the SFR (see Appendix C).
3.4. Mock-observed signatures of noncircular motions
We oriented our simulated galaxy in a similar way as GN4_32842 and computed the LOS contributions of the planar velocities to derive the expected observational signatures. We used the inclination and PA of GN4_32842 to orient our simulated spiral. Since our disk includes the bar (i.e., a nonaxisymmetric feature), we made sure that its resulting observed PA matches that of GN4_32842 by following the procedure presented in Appendix D. This is a critical step, since the strong deviations from axisymmetry in our simulated velocity fields result in different observational signatures depending on the difference between the disk and bar PAs.
The projected stellar surface density of our simulation is shown in Fig. 5. The 1 0 scalebar shown for reference assumes the simulated spiral to be at z ≈ 1.52. The distribution of the stellar mass resembles that of GN4_32842, with the bar appearing as a central elongated structure with spiral arms attached to its ends. Even beyond the bar radius, in regions where the S/N of our observation does not allow for the identification of coherent residual patterns, the three-armed morphologies, identified in both cases, highlight the similarities between our observed and simulated barred spirals. Similarly for the cold gaseous component, the higher surface density at the leading side of the bar identified in the simulation is also discernible in GN4_32842, albeit less clearly due the effects of the observational PSF.
Regarding the gas kinematics, while the computation of the total LOS velocities is straightforward, a more refined approach is needed to derive predictions for the velocity residuals. As shown in Appendix E, these residuals are the combined LOS contributions of all motions deviating from axisymmetric rotation. Having confirmed the absence of significant vertical motions, these deviations can be either along the radial or the tangential direction. While radial motions are by definition noncircular, in the tangential direction the contribution of the disk rotation has to be subtracted. Thus, we refer to these in-plane noncircular (i.e., azimuthally varying) tangential motions as “residual tangential” velocities.
Following an observationally motivated approach, we estimated the rotation by using a ≈0 15 wide pseudo-slit with a length of ≈1
 0 (at z ≈ 1.52), sampled with 60 pixels along the PA of the galaxy in the face-on orientation. This sampling provided both a good radial resolution and a realistically wide slit. The rotational velocity profile was estimated from the mass-averaged tangential velocities of the star-forming gas cells falling within the bounds of each pixel of the slit. These rotational velocities were subsequently subtracted from the tangential velocities of the gas cells falling into a radial bin corresponding to that pixel, resulting in the residual tangential velocity vectors.
Next, we computed the LOS contributions of the radial vr, LOS and residual tangential vθ, resid, LOS planar velocities, for all star-forming gas cells which were in turn binned into a grid projected on the sky plane. These LOS velocities of each projected pixel were derived as the mass-averaged contributions of all cold gas cells that fell within its bounds. The corresponding mock-observed LOS velocity maps are presented in Fig. 6.
 |
Fig. 6. Simulation: LOS velocities of the cold gas (first from left), the LOS contributions of the radial (second from left) and perturbations to the tangential (third from left) components of the in-plane velocities of the star-forming gas particles, as well as the total LOS residual velocities (fourth from left). The scalebars indicate the size of 0 |

These maps provide us with insights into the expected LOS velocity contributions from gas flows in a gas-rich, barred spiral. In the mock observed LOS velocity field, we identify a highly resolved spider diagram, albeit with significant distortions, caused by the previously identified strong in-plane deviations from axisymmetric rotation.
Turning to the individual contributions of the planar radial velocities, we find strong positive and negative signatures on the northern and southern semi-axis of the PA, respectively. These contributions are minimal in the region between the disk and bar PA axes, for the following two reasons: i) the radial velocities have very limited LOS contributions in the region around the PA (van der Kruit & Allen 1978; Genzel et al. 2023) (see also Appendix E.4.1), and ii) in the case of a strong bar the dust lane shocks are straight and closer to the bar major axis (Athanassoula 1992b) with the radial velocities changing from positive to negative, following the direction of the flow, at the loci of the shocks, leading to a smearing effect. This is also the case for the shear flow identified in the turbulent, gas-rich, bar simulations of Bland-Hawthorn et al. (2024).
In the signatures from the in-plane residual tangential velocities, we can disentangle the contributions from the faster and slower rotation patterns, along and perpendicular to the bar respectively, with an additional change in sign introduced by the presence of the disk minor axis. Thus, slower rotation at the loci of the shocks produces positive residuals at the northern part of our galaxy and negative at the southern part, with faster rotation having the opposite effect.
Considering that the observed residuals would in reality be the sum of the above, an extra layer of complexity is introduced. On the other hand, the knowledge of the expected signatures allows for a more detailed interpretation of the observed residuals. Namely, in the rightmost plot of Fig. 6, the positive residuals at the top left part of the galaxy indicate in-plane outflowing material, the positive values between the PA of the bar and disk are the result of slower rotation in the presence of the northern bar lane and the absence of a coherent pattern on the top right part is indicative of both faster rotation and inflows. At the bottom part, similar arguments can be made with any differences arising from anisotropies in the flow patterns, which are expected in the case of gas-rich turbulent disks. In short, we have shown that considering the LOS contributions of the radial and tangential velocities separately is crucial in interpreting the in-plane gas motions in our simulated barred spiral.
4. Discussion
In this paper, we present our latest deep CO(3–2) observation of a main sequence, barred spiral galaxy at cosmic noon using the IRAM-NOEMA interferometer. The exquisite quality of the data, with a total integration time roughly equivalent to 50 hours on source with 12 antennas, enabled us to probe in great detail the high order kinematics of our z ≈ 1.52 target uncovering coherent patterns reminiscent of noncircular motions in the presence of a bar. The stellar continuum observed using both HST and JWST has provided us with a clear image of the barred morphology, allowing for the study of correlations between kinematical and morphological features.
With a view to gain deeper insights on this correlation, we simulated an isolated disk at high-resolution using the moving mesh code AREPO (Springel 2010; Weinberger et al. 2020) and the TNG sub-grid model, used in some of the most popular cosmological simulations to date (Nelson et al. 2019). Using our theoretical model, we examined the expected planar gas flows in a typical, massive, gas-rich barred galaxy, identifying clear patterns in the form of radial flows and deviations from regular, axisymmetric rotation that are in agreement with the theoretical literature of both local-like (e.g., Athanassoula 1992b; Patsis & Athanassoula 2000; Pastras et al. 2022) and gas-rich turbulent bars (Bland-Hawthorn et al. 2024). We also derived predictions for their possible observational signatures in the form of LOS velocity residuals for an orientation similar to GN4_32842.
4.1. Comparison between observed and simulated signatures of noncircular motions
In this section, we interpret the possible nature of the noncircular motions in GN4_32842 using our theoretical model, through the comparison of the observed and simulated velocity fields presented in Fig. 7.
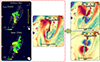 |
Fig. 7. Comparison between the observed LOS velocity residuals (top and bottom left) and the expected residuals from the simulation (middle), derived as the combined LOS contribution of the radial (top right), and residual tangential (bottom left) planar velocities. The solid and dashed lines indicate the PA of the galaxy and the bar, respectively. There is an apparent qualitative agreement between the simulated and observed residual patterns. Our high-resolution uniformly weighted data capture in detail the gas streaming motions on the southern part of the bar, with respect to the center of the galaxy, while the tapered weighted data enable the additional identification of the outflows at its northern trailing part (and possibly the effect of the northern dust lane shock at the leading one). Insights from the in-plane radial and tangential LOS contributions uncover the nature of planar flows in GN4_32842: faster (slower) azimuthal streaming along the minor (major) axis of the bar, outflows at the trailing side of its major axis, and inflows at the leading one with their observational signatures being damped due to their proximity to the kinematic major axis and opposite contributions stemming from faster azimuthal streaming. |
The close resemblance between the observed and simulated patterns is apparent. Considering the different spatial frequencies to which the weighting scheme of each data product is more sensitive, in addition to the sizes of the PSFs, makes the comparison straightforward; our uniformly weighted data are able to recover the high-frequency signal in the southern part of the bar region, while the uniformly weighted data capture the low-frequency global pattern. In that context, the observed residual patterns are in both cases compatible with the mock observation of our simulated galaxy.
In our highest resolution uniformly weighted data, we identify a streaming pattern with positive values on the eastern and negative on the western part of our galaxy. This pattern is located at the southern part of the galaxy with respect to its center. We find a similar pattern in the simulated case. Its origins can be in turn traced back to outflows on the trailing side of the bar and faster rotation on the leading side, however, with the expected residuals from slower rotation due to the shock along the bar PA not observed for our target, possibly due to our observational PSF. At the northern part, both positive and negative residuals are identified on the eastern side of our target which is not the case for the simulation. However, the direction of the PSF elongation as well as the reduced amplitude of the positive simulated residuals in the corresponding region, minimize the significance of this disagreement; the observed pattern could be either an artifact of the PSF or a region of stronger tangential and/or weaker radial noncircular motions.
In our tapered data, a better recovery of the extended emission additionally reveals the positive residuals at the northeastern part, resulting from planar outflows and possibly slower rotation along the northern dust lane shock, according to our mock observed LOS signatures. At the northwestern leading side of the bar, no coherent pattern is observed, potentially due to the opposite contributions of the expected in-plane radial inflows and faster rotation, which could lead to the damping of any LOS velocity residuals in that region.
The apparent qualitative agreement between the observed and simulated residual patterns provides evidence of the nature of the underlying gas streaming in the disk plane of the cosmic noon barred galaxy targeted in this work. A further comparison between the overall residual amplitudes in the two cases support our observationally derived conclusion that in-plane noncircular streaming is rapid with velocities of the order of ≈60 km/s. The respective amplitudes in our simulated spiral are higher, of the order of ∼100 km/s. Radial flows of similar amplitudes have been recently observed along bars and spiral arms in a sample of 9 massive z ∼ 1 − 2.5 disk galaxies (Genzel et al. 2023). In that study a z ≈ 2.2 barred galaxy was used as a showcase in which inflows were identified along the bar at a position angle ≈40° off the minor axis of the disk. With this angular difference allowing for a clear identification of the converging flows, the inferred in-plane radial velocities were ≈95 km/s. In our case, the orientation of the bar is such that any signatures from negative radial velocities could be considerably damped either due to their proximity to the major kinematic axis or by the presence of opposite signatures from tangential motions in excess to the circular velocity. Thus, our work takes advantage of the excellent sensitivity and resolving capabilities of the IRAM-NOEMA interferometer as well as one of the most advanced theoretical models of galaxy evolution to infer their presence through the coherent picture of gas streaming in a high-redshift barred galaxy.
4.2. Implications of the combined observational and theoretical analyses
Leveraging the qualitative agreement between the observed and simulated gas streaming patterns, we can use their known properties in the case of our simulated galaxy to infer those of the planar gas streams in the observed z ≈ 1.52 barred spiral. We computed the simulated radial flow rate profiles in Appendix C, identifying a net inflow across the whole extent of the disk. The net inflow rate is of the order of the SFR, in agreement with theoretical predictions (e.g., Hung et al. 2019) and observational measurements for high-z bars (Huang et al. 2025). The relative amplitude of the gas flows, with respect to the SFR, increases in the bar region, leading to efficient gas transport inwards, thus contributing to the build up of a significant central mass concentration in a few Gyr.
In local barred galaxies, cases of such central mass concentrations with low Sérsic indices (ns ≤ 2) (e.g., Gadotti et al. 2020; Gargiulo et al. 2022) have been shown to include a dynamically cold, kinematically supported stellar component, namely, a nuclear disk (Gadotti et al. 2015, 2020; Bittner et al. 2020; de Sá-Freitas et al. 2023a,b, 2025; Fraser-McKelvie et al. 2025). Evidence of the presence of these structures at cosmic noon, unveiled through the age-dating of their stellar populations at low-z (Gadotti et al. 2015; de Sá-Freitas et al. 2023a, 2025), highlight the possible role of high redshift bars in fueling their inside-out growth by driving gas inflows (Bittner et al. 2020). If a nuclear disk is present in the central regions of our target, the observed radial flows, and their expected net effect according to our simulation, could provide evidence of such a fueling process in action at high-z.
Environmental factors, such as mergers or interactions, have also been long known to trigger radial gas flows promoting the formation of central concentrations in affected galaxies (e.g., Toomre & Toomre 1972; Hernquist 1989; Barnes & Hernquist 1991; Hernquist & Barnes 1991). In the case of minor mergers, the survival of thin disks with low Toomre Q parameters is possible for gas-rich disks due to the significantly reduced disk thickening (Moster et al. 2010). Additionally, bar formation can be triggered or accelerated by such interactions (e.g., Noguchi 1987; Miwa & Noguchi 1998; Gerin et al. 1990; Łokas et al. 2014; Łokas 2018; Peschken & Łokas 2019; Merrow et al. 2024; Rosas-Guevara et al. 2024; Zheng & Shen 2025; Fragkoudi et al. 2025; Zheng et al. 2025), with studies of cosmological zoom-in simulations suggesting a correlation between the time of bar formation at high-z and that of a significant interaction (Fragkoudi et al. 2025). While the mode of bar formation is not at the focus of our study, the increased frequency of fly-bys and mergers at high redshift (e.g., Fakhouri & Ma 2008; Genel et al. 2009; Rodriguez-Gomez et al. 2015; O’Leary et al. 2021), means that the bar in our target could be tidally triggered.
Significant contributions to the radial flows by possible interactions with a companion would complicate the identification of the main driver of the observed gas flows. We therefore explored the candidate neighbors of GN4_32842. We find that such candidates within 250 kpc in projection, all have masses ≲1/4× that of our target and lie within dproj ≳ 75 kpc. The most massive of them lies at a distance in projection > 2× its Jacobi radius, has a velocity offset of ≈955 km/s and a mass of ≈1/4× that of GN4_32842. We conclude that the observed kinematics of our target are not significantly affected by a companion (e.g., Genzel et al. 2017, 2020). This result, in conjunction with our simulated barred spiral in isolation, highlight the role of the bar in driving the observed noncircular gas motions.
With these aspects in mind, the significant implications of our study to the current picture of galaxy evolution can be summarized as follows:
-
Given the higher fractions of barred galaxies reported in studies based on JWST imaging at z ∼ 1 − 3, bars could have a critical role in driving secular evolution in a significant portion of disk galaxies at cosmic noon. Our observation provides a detailed picture of noncircular motions in a typical, massive barred spiral galaxy. The inferred amplitude of these in-plane noncircular motions is of the order of ≈60 km/s. A direct comparison with our high-resolution simulated model, where the net radial flow rate is of a similar order to that of the SFR, implies that the respective value for GN4_32842 could be of the order of ∼100 M⊙/yr.
-
The inferred radial velocities in the case of GN4_32842 are remarkably high, exceeding the respective Toomre velocity. Our target serves as a complementary example to the sample of nine massive, main sequence, cosmic noon galaxies by Genzel et al. (2023), where the derived velocities of the radial flows were found to be higher than the predicted values. In our case, the role of nonaxisymmetric features, such as bars or spirals, in driving these rapid radial flows is highlighted.
-
Our observational and theoretical interpretation point toward the vital role of the higher gas content of cosmic noon galaxies (Tacconi et al. 2018, 2020; Förster Schreiber & Wuyts 2020), instability of disks (Genzel et al. 2011, 2014), and nonaxisymmetric features in driving efficient radial inflows, funneling gas toward the central regions and fueling the growth of central mass concentrations in short timescales. The high radial velocities observed, considered in conjunction with the high gas column densities, provide observational evidence of this process in action.
-
Finally, gas flow patterns in the presence of bars appear to be qualitatively similar at high and low redshift. Our study adds another object to a handful of examples supporting this conclusion; Q2343_BX610 studied by Genzel et al. (2023), the barred DSFGs studied by Amvrosiadis et al. (2025) and Umehata et al. (2025), as well as the very massive J0107a Huang et al. (2025). Additionally, the latest simulations of gas-rich, barred spirals, such as those of Bland-Hawthorn et al. (2024) and the one presented in this work, also support this picture.
5. Conclusions
In this paper, we present a very deep CO(3–2) observation of GN4_32842, a massive, main sequence, barred spiral galaxy at z ≈ 1.52. The exquisite data quality allows us to probe the molecular gas flows in the plane of its turbulent, gas-rich disk. Our analysis was carried out on two data products using uniform weighting and tapering, thereby offering excellent resolution and increased sensitivity, respectively. We fit the major axis kinematics using parametric forward modeling and subtracted the beam-smeared model velocity and velocity dispersion fields revealing signatures of the higher order, noncircular motions. In the residual velocity fields, we identified:
-
a streaming pattern of negative residuals at the western side of the galaxy and positive at the eastern in our highest resolution data;
-
an additional pattern of positive residuals at the northern side of the galaxy in our more sensitive data.
Aiming to constrain the nature of the underlying in-plane motions, we simulated a massive, gas-rich disk galaxy, resembling a typical cosmic noon galaxy, in isolation. We used the moving mesh code AREPO (Springel 2010; Weinberger et al. 2020) and the TNG sub-grid model (Pillepich et al. 2018; Weinberger et al. 2017), with increased wind specific energy, leading to reduced clump formation, allowing for early bar formation. We studied the gas flows in a characteristic snapshot following the formation of a gas-rich bar, identifying the theoretically expected patterns associated with it (e.g., Roberts et al. 1979; Athanassoula 1992b; Wada 1994; Patsis & Athanassoula 2000; Bland-Hawthorn et al. 2024). These patterns comprise i) a quadrupole pattern of high radial velocities with inflows at the leading side of the bar and outflows at the trailing one and ii) regions of slower rotation at the loci of the bar lanes and faster rotation along the minor axis of the bar. The typical amplitudes of these deviations from axisymmetric rotation are of the order of ∼100 km/s.
We estimated the expected signatures of these motions in a mock observed velocity field by orienting our simulated barred spiral in a similar way to that of GN4_32842 and deriving their LOS components. We combined the effects of both types of streaming and compared the results with the observed velocity residuals, reaching the following conclusions about our z ≈ 1.52 target:
-
the observed high order gas flows are in qualitative agreement with expected patterns in the presence of a gas-rich bar;
-
the features in the residual velocity fields stem from the combined contributions of diverging flows (outflows) and azimuthal variations of the tangential velocities with respect to the circular velocity, as well as the possibly damped observational signatures of converging flows (inflows);
-
these noncircular motions are rapid, with planar velocities of the order of ≈60 km/s.
The inferred gas flows are in agreement with the first detections of significant noncircular motions in barred galaxies at high redshift (Genzel et al. 2023; Amvrosiadis et al. 2025; Umehata et al. 2025; Huang et al. 2025). Our study leverages the excellent sensitivity and resolving capabilities of the IRAM-NOEMA interferometer to provide detailed insights into the nature of the observed patterns in a typical barred galaxy at cosmic noon, finding a remarkable agreement with theoretical expectations. Additionally, the direct comparison with our high-resolution simulation offers a prediction for their net effect in the form of a net radial inflow that is of the same order as the SFR.
Considering that bars have been identified in significant numbers in cosmic noon galaxies (e.g., Guo et al. 2023; Huang et al. 2023; Costantin et al. 2023; Le Conte et al. 2024; Guo et al. 2025; Géron et al. 2025; Espejo Salcedo et al. 2025), along with the possibility of the intrinsic bar fractions being even higher (Liang et al. 2024), our results imply that in these systems, the gas transport toward the central regions and building of bulges, nuclear disks, and central gas reservoirs, as well as the possible feeding of supermassive black holes (SMBHs), could be driven by shocks and inflows due to the presence of these nonaxisymmetric structures. This is in correspondence to findings for local cases (Chown et al. 2019; Yu et al. 2022) and in agreement with theoretical predictions (Roberts et al. 1979; Athanassoula 1992b; Bland-Hawthorn et al. 2024).
All data were taken with 10–12 antennas.
Acknowledgments
The authors thank the anonymous referee for the useful comments that helped improve the paper. S.P. is thankful to Rüdiger Pakmor for his insightful suggestions on modifications to the TNG model for the suppression of clump formation and Panos Patsis for stimulating discussions on the dynamics of barred galaxies. N.M.F.S. acknowledges support, and C.B., J.C., J.M.E.S., G.T. are funded by the European Union (ERC, GALPHYS, 101055023). H.Ü. acknowledges funding by the EU (ERC APEX, 101164796). Views and opinions expressed are, however, those of the author(s) only and do not necessarily reflect those of the EU or the ERC. Neither the EU nor the granting authority can be held responsible for them. T.N. acknowledges the support of the Deutsche Forschungsgemeinschaft (DFG, German Research Foundation) under Germany’s Excellence Strategy – EXC-2094 – 390783311 of the DFG Cluster of Excellence ‘ORIGINS’. S.G-B. acknowledges support from the Spanish grant PID2022-138560NB-I00, funded by MCIN/AEI/10.13039/501100011033/FEDER, EU. R.H-C. thanks the Max Planck Society for support under the Partner Group project ‘The Baryon Cycle in Galaxies’ between the Max Planck for Extraterrestrial Physics and the Universidad de Concepción. R.H-C. gratefully acknowledges financial support from ANID – MILENIO – NCN2024_112 and ANID BASAL FB210003. M.L. acknowledges support from the European Union’s Horizon Europe research and innovation programme under the Marie Skłodowska-Curie grant agreement No 101107795. L.S. acknowledges the financial support from the PhD grant funded on PNRR Funds Notice No. 3264 28-12-2021 PNRR M4C2 Reference IR0000034 STILES Investment 3.1 CUP C33C22000640006. The data analyzed in this paper are CO observations taken as part of the NOEMA3D guaranteed time project at the Northern Extended Array for Millimeter Astronomy (NOEMA, located on the Plateau de Bure) Interferometer of the Institute for Radio Astronomy in the Millimeter Range (IRAM), Grenoble, France. IRAM is supported by INSU/CNRS (France), MPG (Germany), and IGN (Spain). This work is also based in part on observations made with the NASA/ESA/CSA James Webb Space Telescope. The data were obtained from the Mikulski Archive for Space Telescopes at the Space Telescope Science Institute, which is operated by the Association of Universities for Research in Astronomy, Inc., under NASA contract NAS 5-03127 for JWST. These observations are associated with program #1181 and can be accessed via DOI.org/10.17909/7zbz-tt49. This research is also based on observations made with the NASA/ESA Hubble Space Telescope obtained from the Space Telescope Science Institute, which is operated by the Association of Universities for Research in Astronomy, Inc., under NASA contract NAS 5–26555. These observations are associated with the CANDELS Multi-Cycle Treasury Program. Some of the data products presented herein were retrieved from the Dawn JWST Archive (DJA). DJA is an initiative of the Cosmic Dawn Center (DAWN), which is funded by the Danish National Research Foundation under grant DNRF140. We also acknowledge the use of the following open-source software: NumPy (Harris et al. 2020), SciPy (Virtanen et al. 2020), Astropy (Astropy Collaboration 2022), Photutils (Bradley et al. 2024), Matplotlib (Hunter 2007), CMasher (van der Velden 2020), TRILOGY (Coe et al. 2012), pygad (Röttgers 2018; Röttgers et al. 2020), GILDAS (Gildas Team 2013) and DysmalPy (Davies et al. 2004b,a; Cresci et al. 2009; Davies et al. 2011; Wuyts et al. 2016b; Lang et al. 2017; Price et al. 2021; Lee et al. 2025).
References
- Abraham, R. G., Merrifield, M. R., Ellis, R. S., Tanvir, N. R., & Brinchmann, J. 1999, MNRAS, 308, 569 [NASA ADS] [CrossRef] [Google Scholar]
- Amvrosiadis, A., Lange, S., Nightingale, J. W., et al. 2025, MNRAS, 537, 1163 [Google Scholar]
- Astropy Collaboration (Price-Whelan, A. M., et al.) 2022, ApJ, 935, 167 [NASA ADS] [CrossRef] [Google Scholar]
- Athanassoula, E. 1992a, MNRAS, 259, 328 [NASA ADS] [CrossRef] [Google Scholar]
- Athanassoula, E. 1992b, MNRAS, 259, 345 [Google Scholar]
- Athanassoula, E. 2002, ApJ, 569, L83 [NASA ADS] [CrossRef] [Google Scholar]
- Athanassoula, E. 2003, MNRAS, 341, 1179 [Google Scholar]
- Athanassoula, E. 2008, MNRAS, 390, L69 [NASA ADS] [CrossRef] [Google Scholar]
- Athanassoula, E. 2012, MNRAS, 426, L46 [NASA ADS] [Google Scholar]
- Athanassoula, E., & Sellwood, J. A. 1986, MNRAS, 221, 213 [Google Scholar]
- Athanassoula, E., Lambert, J. C., & Dehnen, W. 2005, MNRAS, 363, 496 [Google Scholar]
- Athanassoula, E., Machado, R. E. G., & Rodionov, S. A. 2013, MNRAS, 429, 1949 [Google Scholar]
- Barnes, J., & Efstathiou, G. 1987, ApJ, 319, 575 [NASA ADS] [CrossRef] [Google Scholar]
- Barnes, J. E., & Hernquist, L. E. 1991, ApJ, 370, L65 [Google Scholar]
- Beckman, J. E., Zurita, A., & Vega Beltrán, J. C. 2004, in Lecture Notes and Essays in Astrophysics, eds. A. Ulla, & M. Manteiga, 1, 43 [Google Scholar]
- Behrendt, M., Burkert, A., & Schartmann, M. 2015, MNRAS, 448, 1007 [NASA ADS] [CrossRef] [Google Scholar]
- Bittner, A., Sánchez-Blázquez, P., Gadotti, D. A., et al. 2020, A&A, 643, A65 [NASA ADS] [CrossRef] [EDP Sciences] [Google Scholar]
- Bland-Hawthorn, J., Tepper-Garcia, T., Agertz, O., & Freeman, K. 2023, ApJ, 947, 80 [NASA ADS] [CrossRef] [Google Scholar]
- Bland-Hawthorn, J., Tepper-Garcia, T., Agertz, O., & Federrath, C. 2024, ApJ, 968, 86 [Google Scholar]
- Bouché, N. F., Bera, S., Krajnović, D., et al. 2022, A&A, 658, A76 [NASA ADS] [CrossRef] [EDP Sciences] [Google Scholar]
- Bournaud, F., Combes, F., Jog, C. J., & Puerari, I. 2005, A&A, 438, 507 [NASA ADS] [CrossRef] [EDP Sciences] [Google Scholar]
- Bradley, L., Sipőcz, B., Robitaille, T., et al. 2024, astropy/photutils: 1.11.0 [Google Scholar]
- Brammer, G. 2023, https://doi.org/10.5281/zenodo.7767790 [Google Scholar]
- Bullock, J. S., Dekel, A., Kolatt, T. S., et al. 2001, ApJ, 555, 240 [NASA ADS] [CrossRef] [Google Scholar]
- Burkert, A., Förster Schreiber, N. M., Genzel, R., et al. 2016, ApJ, 826, 214 [Google Scholar]
- Buta, R., & Combes, F. 1996, Fund. Cosmic Phys., 17, 95 [Google Scholar]
- Chown, R., Li, C., Athanassoula, E., et al. 2019, MNRAS, 484, 5192 [NASA ADS] [CrossRef] [Google Scholar]
- Coe, D., Umetsu, K., Zitrin, A., et al. 2012, ApJ, 757, 22 [NASA ADS] [CrossRef] [Google Scholar]
- Combes, F., & Sanders, R. H. 1981, A&A, 96, 164 [NASA ADS] [Google Scholar]
- Contopoulos, G. 1971, ApJ, 163, 181 [NASA ADS] [CrossRef] [Google Scholar]
- Contopoulos, G. 1980, A&A, 81, 198 [NASA ADS] [Google Scholar]
- Contopoulos, G., & Grosbol, P. 1989, A&ARv, 1, 261 [Google Scholar]
- Contopoulos, G., & Papayannopoulos, T. 1980, A&A, 92, 33 [NASA ADS] [Google Scholar]
- Costantin, L., Pérez-González, P. G., Guo, Y., et al. 2023, Nature, 623, 499 [NASA ADS] [CrossRef] [Google Scholar]
- Cresci, G., Hicks, E. K. S., Genzel, R., et al. 2009, ApJ, 697, 115 [Google Scholar]
- Davies, R. I., Tacconi, L. J., & Genzel, R. 2004a, ApJ, 613, 781 [NASA ADS] [CrossRef] [Google Scholar]
- Davies, R. I., Tacconi, L. J., & Genzel, R. 2004b, ApJ, 602, 148 [NASA ADS] [CrossRef] [Google Scholar]
- Davies, R., Förster Schreiber, N. M., Cresci, G., et al. 2011, ApJ, 741, 69 [NASA ADS] [CrossRef] [Google Scholar]
- de Sá-Freitas, C., Fragkoudi, F., Gadotti, D. A., et al. 2023a, A&A, 671, A8 [NASA ADS] [CrossRef] [EDP Sciences] [Google Scholar]
- de Sá-Freitas, C., Gadotti, D. A., Fragkoudi, F., et al. 2023b, A&A, 678, A202 [NASA ADS] [CrossRef] [EDP Sciences] [Google Scholar]
- de Sá-Freitas, C., Gadotti, D. A., Fragkoudi, F., et al. 2025, A&A, 698, A5 [NASA ADS] [CrossRef] [EDP Sciences] [Google Scholar]
- Dutta Chowdhury, D., Dekel, A., Mandelker, N., Ginzburg, O., & Genzel, R. 2024, https://doi.org/10.1051/0004-6361/202452095 [Google Scholar]
- Efstathiou, G., Lake, G., & Negroponte, J. 1982, MNRAS, 199, 1069 [NASA ADS] [CrossRef] [Google Scholar]
- Eisenstein, D. J., Willott, C., Alberts, S., et al. 2023, ApJS, submitted [arXiv:2306.02465] [Google Scholar]
- Elmegreen, B. G., Elmegreen, D. M., & Hirst, A. C. 2004, ApJ, 612, 191 [NASA ADS] [CrossRef] [Google Scholar]
- Erwin, P. 2018, MNRAS, 474, 5372 [Google Scholar]
- Erwin, P., & Sparke, L. S. 2003, ApJS, 146, 299 [NASA ADS] [CrossRef] [Google Scholar]
- Eskridge, P. B., Frogel, J. A., Pogge, R. W., et al. 2000, AJ, 119, 536 [NASA ADS] [CrossRef] [Google Scholar]
- Espejo Salcedo, J. M., Pastras, S., Vácha, J., et al. 2025, A&A, 700, A42 [NASA ADS] [CrossRef] [EDP Sciences] [Google Scholar]
- Fakhouri, O., & Ma, C.-P. 2008, MNRAS, 386, 577 [NASA ADS] [CrossRef] [Google Scholar]
- Fall, S. M. 1983, in Internal Kinematics and Dynamics of Galaxies, ed. E. Athanassoula, IAU Symp., 100, 391 [Google Scholar]
- Förster Schreiber, N. M., Genzel, R., Bouché, N., et al. 2009, ApJ, 706, 1364 [Google Scholar]
- Förster Schreiber, N. M., & Wuyts, S. 2020, ARA&A, 58, 661 [Google Scholar]
- Fragkoudi, F., Grand, R. J. J., Pakmor, R., et al. 2020, MNRAS, 494, 5936 [Google Scholar]
- Fragkoudi, F., Grand, R. J. J., Pakmor, R., et al. 2021, A&A, 650, L16 [NASA ADS] [CrossRef] [EDP Sciences] [Google Scholar]
- Fragkoudi, F., Grand, R. J. J., Pakmor, R., et al. 2025, MNRAS, 538, 1587 [Google Scholar]
- Fraser-McKelvie, A., van de Sande, J., Gadotti, D. A., et al. 2025, A&A, 700, A237 [NASA ADS] [CrossRef] [EDP Sciences] [Google Scholar]
- Fujii, M. S., Bédorf, J., Baba, J., & Portegies Zwart, S. 2018, MNRAS, 477, 1451 [NASA ADS] [CrossRef] [Google Scholar]
- Gadotti, D. A., Athanassoula, E., Carrasco, L., et al. 2007, MNRAS, 381, 943 [NASA ADS] [CrossRef] [Google Scholar]
- Gadotti, D. A., Seidel, M. K., Sánchez-Blázquez, P., et al. 2015, A&A, 584, A90 [NASA ADS] [CrossRef] [EDP Sciences] [Google Scholar]
- Gadotti, D. A., Bittner, A., Falcón-Barroso, J., et al. 2020, A&A, 643, A14 [NASA ADS] [CrossRef] [EDP Sciences] [Google Scholar]
- García-Burillo, S., Combes, F., Schinnerer, E., Boone, F., & Hunt, L. K. 2005, A&A, 441, 1011 [NASA ADS] [CrossRef] [EDP Sciences] [Google Scholar]
- Gargiulo, I. D., Monachesi, A., Gómez, F. A., et al. 2022, MNRAS, 512, 2537 [NASA ADS] [CrossRef] [Google Scholar]
- Genel, S., Genzel, R., Bouché, N., Naab, T., & Sternberg, A. 2009, ApJ, 701, 2002 [NASA ADS] [CrossRef] [Google Scholar]
- Genzel, R., Förster Schreiber, N. M., Lang, P., et al. 2014, ApJ, 785, 75 [NASA ADS] [CrossRef] [Google Scholar]
- Genzel, R., Förster Schreiber, N. M., Übler, H., et al. 2017, Nature, 543, 397 [Google Scholar]
- Genzel, R., Jolly, J. B., Liu, D., et al. 2023, ApJ, 957, 48 [NASA ADS] [CrossRef] [Google Scholar]
- Genzel, R., Tacconi, L. J., Eisenhauer, F., et al. 2006, Nature, 442, 786 [Google Scholar]
- Genzel, R., Newman, S., Jones, T., et al. 2011, ApJ, 733, 101 [Google Scholar]
- Genzel, R., Price, S. H., Übler, H., et al. 2020, ApJ, 902, 98 [NASA ADS] [CrossRef] [Google Scholar]
- Gerin, M., Combes, F., & Athanassoula, E. 1990, A&A, 230, 37 [NASA ADS] [Google Scholar]
- Géron, T., Smethurst, R. J., Dickinson, H., et al. 2025, ApJ, 987, 74 [Google Scholar]
- Ghosh, S., Fragkoudi, F., Di Matteo, P., & Saha, K. 2023, A&A, 674, A128 [NASA ADS] [CrossRef] [EDP Sciences] [Google Scholar]
- Gildas Team 2013, Astrophysics Source Code Library [record ascl:1305.010] [Google Scholar]
- Grogin, N. A., Kocevski, D. D., Faber, S. M., et al. 2011, ApJS, 197, 35 [NASA ADS] [CrossRef] [Google Scholar]
- Guo, Y., Jogee, S., Finkelstein, S. L., et al. 2023, ApJ, 945, L10 [NASA ADS] [CrossRef] [Google Scholar]
- Guo, Y., Jogee, S., Wise, E., et al. 2025, ApJ, 985, 181 [Google Scholar]
- Harris, C. R., Millman, K. J., van der Walt, S. J., et al. 2020, Nature, 585, 357 [NASA ADS] [CrossRef] [Google Scholar]
- Hernquist, L. 1989, Nature, 340, 687 [Google Scholar]
- Hernquist, L. 1990, ApJ, 356, 359 [Google Scholar]
- Hernquist, L., & Barnes, J. E. 1991, Nature, 354, 210 [NASA ADS] [CrossRef] [Google Scholar]
- Hohl, F. 1971, ApJ, 168, 343 [NASA ADS] [CrossRef] [Google Scholar]
- Huang, S., Kawabe, R., Kohno, K., et al. 2023, ApJ, 958, L26 [NASA ADS] [CrossRef] [Google Scholar]
- Huang, S., Kawabe, R., Umehata, H., et al. 2025, Nature, 641, 861 [Google Scholar]
- Hung, C.-L., Hayward, C. C., Yuan, T., et al. 2019, MNRAS, 482, 5125 [Google Scholar]
- Hunter, J. D. 2007, Comput. Sci. Eng., 9, 90 [NASA ADS] [CrossRef] [Google Scholar]
- Izquierdo-Villalba, D., Bonoli, S., Rosas-Guevara, Y., et al. 2022, MNRAS, 514, 1006 [NASA ADS] [CrossRef] [Google Scholar]
- Jog, C. J., & Combes, F. 2009, Phys. Rep., 471, 75 [NASA ADS] [CrossRef] [Google Scholar]
- Jogee, S., Barazza, F. D., Rix, H.-W., et al. 2004, ApJ, 615, L105 [NASA ADS] [CrossRef] [Google Scholar]
- Jones, C., & Forman, W. 1984, ApJ, 276, 38 [NASA ADS] [CrossRef] [Google Scholar]
- Kassin, S. A., Weiner, B. J., Faber, S. M., et al. 2012, ApJ, 758, 106 [NASA ADS] [CrossRef] [Google Scholar]
- Kataria, S. K., & Das, M. 2018, MNRAS, 475, 1653 [NASA ADS] [CrossRef] [Google Scholar]
- Kim, W.-T., Seo, W.-Y., & Kim, Y. 2012a, ApJ, 758, 14 [NASA ADS] [CrossRef] [Google Scholar]
- Kim, W.-T., Seo, W.-Y., Stone, J. M., Yoon, D., & Teuben, P. J. 2012b, ApJ, 747, 60 [Google Scholar]
- Koekemoer, A. M., Faber, S. M., Ferguson, H. C., et al. 2011, ApJS, 197, 36 [NASA ADS] [CrossRef] [Google Scholar]
- Kolcu, T., Maciejewski, W., Gadotti, D. A., et al. 2023, MNRAS, 524, 207 [NASA ADS] [CrossRef] [Google Scholar]
- Kraljic, K., Bournaud, F., & Martig, M. 2012, ApJ, 757, 60 [Google Scholar]
- Krumholz, M., & Burkert, A. 2010, ApJ, 724, 895 [NASA ADS] [CrossRef] [Google Scholar]
- Krumholz, M. R., Burkhart, B., Forbes, J. C., & Crocker, R. M. 2018, MNRAS, 477, 2716 [CrossRef] [Google Scholar]
- Lang, P., Förster Schreiber, N. M., Genzel, R., et al. 2017, ApJ, 840, 92 [NASA ADS] [CrossRef] [Google Scholar]
- Le Conte, Z. A., Gadotti, D. A., Ferreira, L., et al. 2024, MNRAS, 530, 1984 [NASA ADS] [CrossRef] [Google Scholar]
- Lee, L. L., Förster Schreiber, N. M., Price, S. H., et al. 2025, ApJ, 978, 14 [Google Scholar]
- Liang, X., Yu, S.-Y., Fang, T., & Ho, L. C. 2024, A&A, 688, A158 [NASA ADS] [CrossRef] [EDP Sciences] [Google Scholar]
- Łokas, E. L. 2018, ApJ, 857, 6 [Google Scholar]
- Łokas, E. L., Athanassoula, E., Debattista, V. P., et al. 2014, MNRAS, 445, 1339 [Google Scholar]
- Lotz, J. M., Davis, M., Faber, S. M., et al. 2008, ApJ, 672, 177 [NASA ADS] [CrossRef] [Google Scholar]
- Lotz, J. M., Jonsson, P., Cox, T. J., et al. 2011, ApJ, 742, 103 [Google Scholar]
- Lynden-Bell, D., & Kalnajs, A. J. 1972, MNRAS, 157, 1 [Google Scholar]
- Lyu, Y., Magnelli, B., Elbaz, D., et al. 2025, A&A, 693, A313 [NASA ADS] [CrossRef] [EDP Sciences] [Google Scholar]
- Maciejewski, W. 2004a, MNRAS, 354, 883 [NASA ADS] [CrossRef] [Google Scholar]
- Maciejewski, W. 2004b, MNRAS, 354, 892 [NASA ADS] [CrossRef] [Google Scholar]
- Madau, P., & Dickinson, M. 2014, ARA&A, 52, 415 [Google Scholar]
- Madau, P., Ferguson, H. C., Dickinson, M. E., et al. 1996, MNRAS, 283, 1388 [Google Scholar]
- Makino, N., Sasaki, S., & Suto, Y. 1998, ApJ, 497, 555 [Google Scholar]
- Margalef-Bentabol, B., Conselice, C. J., Haeussler, B., et al. 2022, MNRAS, 511, 1502 [NASA ADS] [CrossRef] [Google Scholar]
- Martinez-Valpuesta, I., Shlosman, I., & Heller, C. 2006, ApJ, 637, 214 [NASA ADS] [CrossRef] [Google Scholar]
- Melvin, T., Masters, K., Lintott, C., et al. 2014, MNRAS, 438, 2882 [Google Scholar]
- Menéndez-Delmestre, K., Sheth, K., Schinnerer, E., Jarrett, T. H., & Scoville, N. Z. 2007, ApJ, 657, 790 [Google Scholar]
- Merrow, A., Grand, R. J. J., Fragkoudi, F., & Martig, M. 2024, MNRAS, 531, 1520 [CrossRef] [Google Scholar]
- Miller, M. J., & Bregman, J. N. 2013, ApJ, 770, 118 [NASA ADS] [CrossRef] [Google Scholar]
- Miwa, T., & Noguchi, M. 1998, ApJ, 499, 149 [Google Scholar]
- Mo, H. J., Mao, S., & White, S. D. M. 1998, MNRAS, 295, 319 [Google Scholar]
- Moster, B. P., Macciò, A. V., Somerville, R. S., Johansson, P. H., & Naab, T. 2010, MNRAS, 403, 1009 [NASA ADS] [CrossRef] [Google Scholar]
- Moster, B. P., Macciò, A. V., Somerville, R. S., Naab, T., & Cox, T. J. 2011, MNRAS, 415, 3750 [NASA ADS] [CrossRef] [Google Scholar]
- Moster, B. P., Macciò, A. V., Somerville, R. S., Naab, T., & Cox, T. J. 2012, MNRAS, 423, 2045 [NASA ADS] [CrossRef] [Google Scholar]
- Moster, B. P., Naab, T., & White, S. D. M. 2020, MNRAS, 499, 4748 [Google Scholar]
- Naab, T., & Ostriker, J. P. 2017, ARA&A, 55, 59 [Google Scholar]
- Navarro, J. F., Frenk, C. S., & White, S. D. M. 1996, ApJ, 462, 563 [Google Scholar]
- Nelson, D., Springel, V., Pillepich, A., et al. 2019, Comput. Astrophys. Cosmol., 6, 2 [Google Scholar]
- Nestor Shachar, A., Price, S. H., Förster Schreiber, N. M., et al. 2023, ApJ, 944, 78 [NASA ADS] [CrossRef] [Google Scholar]
- Noguchi, M. 1987, MNRAS, 228, 635 [NASA ADS] [Google Scholar]
- Noordermeer, E. 2008, MNRAS, 385, 1359 [Google Scholar]
- O’Leary, J. A., Moster, B. P., Naab, T., & Somerville, R. S. 2021, MNRAS, 501, 3215 [Google Scholar]
- Ostriker, J. P., & Peebles, P. J. E. 1973, ApJ, 186, 467 [Google Scholar]
- Pastras, S., Patsis, P. A., & Athanassoula, E. 2022, Universe, 8, 290 [Google Scholar]
- Patsis, P. A. 2006, MNRAS, 369, L56 [Google Scholar]
- Patsis, P. A., & Athanassoula, E. 2000, A&A, 358, 45 [NASA ADS] [Google Scholar]
- Peschken, N., & Łokas, E. L. 2019, MNRAS, 483, 2721 [Google Scholar]
- Pettini, M., & Pagel, B. E. J. 2004, MNRAS, 348, L59 [NASA ADS] [CrossRef] [Google Scholar]
- Pillepich, A., Springel, V., Nelson, D., et al. 2018, MNRAS, 473, 4077 [Google Scholar]
- Piner, B. G., Stone, J. M., & Teuben, P. J. 1995, ApJ, 449, 508 [NASA ADS] [CrossRef] [Google Scholar]
- Planck Collaboration VI 2020, A&A, 641, A6 [NASA ADS] [CrossRef] [EDP Sciences] [Google Scholar]
- Power, C., Navarro, J. F., Jenkins, A., et al. 2003, MNRAS, 338, 14 [Google Scholar]
- Price, S. H., Shimizu, T. T., Genzel, R., et al. 2021, ApJ, 922, 143 [NASA ADS] [CrossRef] [Google Scholar]
- Puglisi, A., Dudzevičiūtė, U., Swinbank, M., et al. 2023, MNRAS, 524, 2814 [NASA ADS] [CrossRef] [Google Scholar]
- Roberts, W. W., Jr, Huntley, J. M., & van Albada, G. D. 1979, ApJ, 233, 67 [NASA ADS] [CrossRef] [Google Scholar]
- Rodriguez-Gomez, V., Genel, S., Vogelsberger, M., et al. 2015, MNRAS, 449, 49 [Google Scholar]
- Romeo, A. B., Agertz, O., & Renaud, F. 2023, MNRAS, 518, 1002 [Google Scholar]
- Romero-Gómez, M., Masdemont, J. J., Athanassoula, E., & García-Gómez, C. 2006, A&A, 453, 39 [NASA ADS] [CrossRef] [EDP Sciences] [Google Scholar]
- Romero-Gómez, M., Athanassoula, E., Masdemont, J. J., & García-Gómez, C. 2007, A&A, 472, 63 [NASA ADS] [CrossRef] [EDP Sciences] [Google Scholar]
- Rosas-Guevara, Y., Bonoli, S., Dotti, M., et al. 2022, MNRAS, 512, 5339 [NASA ADS] [CrossRef] [Google Scholar]
- Rosas-Guevara, Y., Bonoli, S., Misa Moreira, C., & Izquierdo-Villalba, D. 2024, A&A, 684, A179 [NASA ADS] [CrossRef] [EDP Sciences] [Google Scholar]
- Rosas-Guevara, Y., Bonoli, S., Puchwein, E., Dotti, M., & Contreras, S. 2025, A&A, 698, A20 [NASA ADS] [CrossRef] [EDP Sciences] [Google Scholar]
- Röttgers, B. 2018, Astrophysics Source Code Library [record ascl:1811.014] [Google Scholar]
- Röttgers, B., Naab, T., Cernetic, M., et al. 2020, MNRAS, 496, 152 [CrossRef] [Google Scholar]
- Saha, K., & Elmegreen, B. 2018, ApJ, 858, 24 [NASA ADS] [CrossRef] [Google Scholar]
- Saha, K., & Jog, C. J. 2014, MNRAS, 444, 352 [Google Scholar]
- Schinnerer, E., Emsellem, E., Henshaw, J. D., et al. 2023, ApJ, 944, L15 [NASA ADS] [CrossRef] [Google Scholar]
- Sellwood, J. A. 1981, A&A, 99, 362 [NASA ADS] [Google Scholar]
- Sellwood, J. A. 2016, ApJ, 819, 92 [Google Scholar]
- Seo, W.-Y., Kim, W.-T., Kwak, S., et al. 2019, ApJ, 872, 5 [NASA ADS] [CrossRef] [Google Scholar]
- Sheth, K., Elmegreen, D. M., Elmegreen, B. G., et al. 2008, ApJ, 675, 1141 [Google Scholar]
- Shlosman, I., Begelman, M. C., & Frank, J. 1990, Nature, 345, 679 [Google Scholar]
- Silva-Lima, L. A., Martins, L. P., Coelho, P. R. T., & Gadotti, D. A. 2022, A&A, 661, A105 [NASA ADS] [CrossRef] [EDP Sciences] [Google Scholar]
- Simmons, B. D., Melvin, T., Lintott, C., et al. 2014, MNRAS, 445, 3466 [NASA ADS] [CrossRef] [Google Scholar]
- Skokos, C., Patsis, P. A., & Athanassoula, E. 2002, MNRAS, 333, 847 [Google Scholar]
- Smail, I., Dudzevičiūtė, U., Gurwell, M., et al. 2023, ApJ, 958, 36 [NASA ADS] [CrossRef] [Google Scholar]
- Sormani, M. C., & Barnes, A. T. 2019, MNRAS, 484, 1213 [NASA ADS] [CrossRef] [Google Scholar]
- Sormani, M. C., Barnes, A. T., Sun, J., et al. 2023, MNRAS, 523, 2918 [NASA ADS] [CrossRef] [Google Scholar]
- Sormani, M. C., Sobacchi, E., & Sanders, J. L. 2024, MNRAS, 528, 5742 [CrossRef] [Google Scholar]
- Springel, V. 2010, MNRAS, 401, 791 [Google Scholar]
- Springel, V., & White, S. D. M. 1999, MNRAS, 307, 162 [CrossRef] [Google Scholar]
- Springel, V., Di Matteo, T., & Hernquist, L. 2005, MNRAS, 361, 776 [Google Scholar]
- Stuber, S. K., Schinnerer, E., Williams, T. G., et al. 2023, A&A, 676, A113 [NASA ADS] [CrossRef] [EDP Sciences] [Google Scholar]
- Suess, K. A., Bezanson, R., Nelson, E. J., et al. 2022, ApJ, 937, L33 [NASA ADS] [CrossRef] [Google Scholar]
- Swinbank, A. M., Harrison, C. M., Trayford, J., et al. 2017, MNRAS, 467, 3140 [NASA ADS] [Google Scholar]
- Tacconi, L. J., Genzel, R., Saintonge, A., et al. 2018, ApJ, 853, 179 [Google Scholar]
- Tacconi, L. J., Genzel, R., & Sternberg, A. 2020, ARA&A, 58, 157 [NASA ADS] [CrossRef] [Google Scholar]
- Toomre, A. 1981, in Structure and Evolution of Normal Galaxies, eds. S. M. Fall, & D. Lynden-Bell, 111 [Google Scholar]
- Toomre, A., & Toomre, J. 1972, ApJ, 178, 623 [Google Scholar]
- Tsukui, T., Wisnioski, E., Bland-Hawthorn, J., et al. 2024, MNRAS, 527, 8941 [Google Scholar]
- Tsukui, T., Wisnioski, E., Bland-Hawthorn, J., & Freeman, K. 2025, MNRAS, 540, 3493 [Google Scholar]
- Übler, H., Genzel, R., Tacconi, L. J., et al. 2018, ApJ, 854, L24 [CrossRef] [Google Scholar]
- Übler, H., Genzel, R., Wisnioski, E., et al. 2019, ApJ, 880, 48 [Google Scholar]
- Umehata, H., Steidel, C. C., Smail, I., et al. 2025, PASJ, 77, 432 [Google Scholar]
- van der Kruit, P. C., & Allen, R. J. 1978, ARA&A, 16, 103 [NASA ADS] [CrossRef] [Google Scholar]
- van der Velden, E. 2020, The Journal of Open Source Software, 5, 2004 [Google Scholar]
- van der Wel, A., Bell, E. F., Häussler, B., et al. 2012, ApJS, 203, 24 [NASA ADS] [CrossRef] [Google Scholar]
- Verwilghen, P., Emsellem, E., Renaud, F., et al. 2024, A&A, 687, A53 [NASA ADS] [CrossRef] [EDP Sciences] [Google Scholar]
- Virtanen, P., Gommers, R., Oliphant, T. E., et al. 2020, Nat. Methods, 17, 261 [Google Scholar]
- Wada, K. 1994, PASJ, 46, 165 [NASA ADS] [Google Scholar]
- Warner, P. J., Wright, M. C. H., & Baldwin, J. E. 1973, MNRAS, 163, 163 [NASA ADS] [Google Scholar]
- Weinberger, R., Springel, V., Hernquist, L., et al. 2017, MNRAS, 465, 3291 [Google Scholar]
- Weinberger, R., Springel, V., & Pakmor, R. 2020, ApJS, 248, 32 [Google Scholar]
- Weng, S., Péroux, C., Karki, A., et al. 2023, MNRAS, 519, 931 [Google Scholar]
- Widrow, L. M., Pym, B., & Dubinski, J. 2008, ApJ, 679, 1239 [Google Scholar]
- Wiersma, R. P. C., Schaye, J., Theuns, T., Dalla Vecchia, C., & Tornatore, L. 2009, MNRAS, 399, 574 [NASA ADS] [CrossRef] [Google Scholar]
- Wisnioski, E., Förster Schreiber, N. M., Wuyts, S., et al. 2015, ApJ, 799, 209 [Google Scholar]
- Wisnioski, E., Förster Schreiber, N. M., Fossati, M., et al. 2019, ApJ, 886, 124 [Google Scholar]
- Wuyts, E., Wisnioski, E., Fossati, M., et al. 2016a, ApJ, 827, 74 [NASA ADS] [CrossRef] [Google Scholar]
- Wuyts, S., Förster Schreiber, N. M., Wisnioski, E., et al. 2016b, ApJ, 831, 149 [Google Scholar]
- Yu, S.-Y., Kalinova, V., Colombo, D., et al. 2022, A&A, 666, A175 [NASA ADS] [CrossRef] [EDP Sciences] [Google Scholar]
- Zhao, D., Du, M., Ho, L. C., Debattista, V. P., & Shi, J. 2020, ApJ, 904, 170 [Google Scholar]
- Zheng, Y., & Shen, J. 2025, ApJ, 979, 60 [Google Scholar]
- Zheng, Y., Shen, J., Wu, X., & Chen, B.-H. 2025, ApJ, 986, 90 [Google Scholar]
Appendix A: Elliptical isophote fitting
In this section, we present the elliptical isophote fitting analysis used to constrain the PA of the bar of GN4_32842. Elliptical isophotes were fitted in the reddest available NIRCam filter (F444W) probing the rest-frame NIR stellar continuum and consequently the bulk of the stellar component of our target. The fitting process was carried out using the respective routine of Photutils (Bradley et al. 2024) after masking the blank region at the northeastern part of the F444W image, two problematic sets of pixels at the eastern part of the galaxy and a region of increased flux near the southwestern edge of the image. We used three iterations of sigma-clipping, each time rejecting values lower and higher by more than 3σ compared to the mean intensity along an elliptical path. We also fixed the center of the isophotes to the position derived through the fitting of a 2D Gaussian to the central concentration (i.e., the bulge), in the same NIRCam image. The resulting isophote ellipticity (e = 1 − b/a, where a and b are the semimajor and semiminor axis, respectively) and position angle (PA) profiles are presented in Fig. A.1.
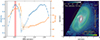 |
Fig. A.1. Observation: Ellipticity and position angle (PA) of the fitted elliptical isophotes as a function of their semimajor axis (SMA) (left) and the image of the galaxy in the NIRCam F444W filter (right). The masked regions excluded from the isophote fitting analysis are shown with dimmer colors while the isophotes, and their respective properties, for which formal convergence was not reached are plotted with semi-transparent colors. The observed bar radius is constrained using the peak of the ellipticity profile, located at ≈ 0 |

We identified clear signatures of the presence of a bar in the ellipticity, namely, a peak at ≈ 0 5 and subsequent drop at ≈ 0
 75–0
75–0 8, and PA, i.e. sharp change at ≈ 0
 7–0
7–0 8, radial profiles of the isophotes. We used the location of the peak in the ellipticity profile to derive the observed projected semimajor axis (SMAbar, proj≈ 0
 5) and PA (PAbar≈ -10°) of the bar following (Liang et al. 2024, but see also Erwin & Sparke 2003). The in-plane bar semimajor axis inferred using the formulation of Appendix D is SMAbar ≈ 4.5 kpc. While the projected semimajor axis of the bar is not used in our analysis, its PA is important due to its effect on the LOS signatures of the in-plane noncircular motions.
Finally, it is also worth comparing the disk orientation derived by this analysis with that constrained through dynamical modeling. Assuming an infinitesimally thin disk and the absence of warps at large radii, its PA and inclination can be derived using the outermost fitted elliptical isophotes, yielding PAmorph≈ -23° and imorph = arccos(1 − e)≈ 49°. The excellent agreement between these values and the kinematically constrained ones (PAkin≈ -20°, ikin≈ 49°) gives additional confidence in our analysis.
Appendix B: Simulation initial conditions
In this section, we present the process of determining the parameters of the initial conditions of our simulation. Aiming to produce a model representative of a typical, massive, main sequence, cosmic noon galaxy that would serve as an apt analog to GN4_32842, we turned to the RC100 sample of massive, star-forming galaxies at z ∼ 0.6 − 2.6 (Nestor Shachar et al. 2023). We used the median properties of the well-constrained mass distributions of these galaxies in conjunction with those of GN4_32842 to produce the initial model used in our simulation.
Overall, our initial system is a rotationally supported disk, a bulge and a dark matter halo (Springel et al. 2005) with the addition of a gaseous halo component (Moster et al. 2011, 2012). The process of constraining their parameters is described in the following subsections.
B.1. Disk
We split the disk into a gaseous and a stellar component each following a thick, exponential profile (Springel et al. 2005). We used a stellar disk with a mass of the same order of magnitude as GN4_32842, namely Mdisk, ★ = 1011 M⊙, and a gaseous mass of Mdisk, gas = 2.5 × 10¹⁰ M⊙, resulting in an initial gas fraction of fgas = Mdisk, gas/(Mdisk, ★ + Mdisk, gas) = 20% in agreement with the observed molecular gas fraction for our target.
We chose the scale length of our stellar disk so that its effective radius is consistent with the median value constrained for the baryonic disks of the RC100 sample (Nestor Shachar et al. 2023), i.e., Rs, disk, ★ ≈ 3 kpc and respectively Reff, disk, ★ ≈ 5 kpc. Despite the fact that no significant indications of a difference in the scale lengths of the gaseous and stellar components of high-redshift galaxies has been observed (Lyu et al. 2025, see also Suess et al. 2022), we generated a gaseous disk twice as extended as the stellar one. The reason is purely computational, since we wanted to prevent a strong starburst phase in the beginning of the simulation resulting from a highly concentrated gaseous disk.
In the vertical direction, the scale height of each disk component was selected so that the fraction of the vertical over the radial scale length is q0, disk = (z0, disk/Rs, disk) = 0.2, in agreement with the assumptions made in the kinematical fitting of GN4_32842 as well as findings of the latest observational studies on the thickness of disks at cosmic noon (Tsukui et al. 2025).
To constrain the metallicity of our gaseous disk, we turned to observations of cosmic noon galaxies and specifically to the KMOS3D survey (Wisnioski et al. 2015, 2019). We used the [NII/Hα] ratios of the highest stellar mass z ∼ 1.5 stacks of Wuyts et al. (2016a) and computed the corresponding 12 + log(O/H) values using the linear relation of Pettini & Pagel (2004). Adopting the solar abundances presented in Wiersma et al. (2009), these ratios correspond to ∼75% and ∼90% Z⊙ for the stacks including all and only no AGN galaxies, respectively. Since the estimated stellar mass of GN4_32842 is even higher than that of the stacks and given the uncertainties in these estimates, we assumed solar metallicity for our initial gaseous disk, in practice setting the initial abundances to those of Wiersma et al. (2009), scaled such that Z⊙ = 0.02.
B.2. Bulge
With respect to the bulge, considering the fitted bulge to total ratio (B/T ≈ 0.09) of Sect. 2, we used a total mass of Mbulge = 1010 M⊙, amounting to 10% of the stellar disk mass in our model. This modest adopted B/T ratio is expected to work in favor of bar formation in our simulated galaxy, since on the contrary, high central mass concentrations can inhibit this process, reduce the bar strength or lead to its destruction (Athanassoula et al. 2005; Saha & Elmegreen 2018; Kataria & Das 2018).
The mass distribution of the bulge is spherical and follows a Hernquist profile (Hernquist 1990) with a scale length resulting in a projected effective radius of Reff, bulge, proj ≈ 1 kpc (Rs, bulge = Reff, bulge, proj/1.8153, Hernquist 1990), in agreement with the adopted assumption for the projected effective radius in the fitting of our target.
B.3. Dark matter and hot gaseous halo
We adopted a virial mass of MDM ≈ 1012 M⊙ for the dark matter halo. We used the average relation c ∼ 10.9 × (1 + z)−0.83 (Genzel et al. 2020) for z ∼ 2 getting a value of c = Rvirial/Rs ≈ 4.5 for the concentration parameter, in agreement with Moster et al. (2020) for star-forming galaxies of the adopted virial mass at this redshift. Since our DM distribution follows a Hernquist profile (Hernquist 1990), its scale length RH was derived from the relation ![Mathematical equation: $ R_H=R_s\sqrt{2[\ln(1+c)-c/(1+c)]} $](/articles/aa/full_html/2025/12/aa55430-25/aa55430-25-eq26.gif) (Springel et al. 2005), with Rs being the scale length of the equivalent NFW profile.
(Springel et al. 2005), with Rs being the scale length of the equivalent NFW profile.
The spin parameter, λ, was constrained by the adopted size of the stellar disk Reff, disk, ★ ≈ 5 kpc, assuming that this disk is a non-self-gravitating system in a halo approximated by an isothermal sphere and rotating with the circular velocity of the halo potential (Mo et al. 1998; Burkert et al. 2016; Genzel et al. 2020). Following the typical assumption that the specific angular momentum is expected to be conserved between the dark matter halo and the disk (jd ∼ md, with jd and md being respectively the angular momentum and mass ratio of the disk and dark matter), (Fall et al. 1983; Mo et al. 1998), we got λ ≈ 0.042. After a small number of iterations in order to closely match the required disk effective radius, our adopted values were jd/md = 1.25 and λ = 0.05 in agreement with typical values in the literature (Barnes & Efstathiou 1987; Bullock et al. 2001).
The final part of our setup concerns the introduction of a hot gaseous halo following a β-profile (Moster et al. 2011, 2012). The aim is to realize a sustained high gas fraction through the cooling of the hot halo gas and replenishment of the cold gas budget in the disk being continuously used up by star formation. This way, cosmic accretion is simulated in an idealized way. We chose the mass of our hot halo so that the total baryonic mass fraction within the virial radius is fbaryons ≈ 0.24, overshooting the constrained cosmic baryonic fraction fbaryons ≈ 0.16 (Planck Collaboration VI 2020) by ∼ 50%, in the interest of simulating the accretion of material from the surrounding cosmic web. Since the baryonic components of our initial conditions are massive, this is necessary for the effect of our hot halo to be considerable.
The core radius and outer slope parameter of the hot halo were set to Rc, hot halo = 0.22 × Rs and β = 2/3 following Moster et al. (2011, 2012), with these values having been derived from Jones & Forman (1984) and Makino et al. (1998) respectively. The angular momentum fraction of the hot halo was set to a ≈ 2 through a process of trial and error, requiring that the bulk of the cooling gas settles at a radius of ≈2Reff, disk, ★.
Finally, since the hot halo gas is expected to be more metal-poor than the disk according to observations of the circumgalactic medium (CGM) at cosmic noon (e.g., Weng et al. 2023), we used one-third solar metallicity for this gaseous component, in agreement with the value constrained for the Milky Way (Miller & Bregman 2013).
Appendix C: Simulation radial flow rates
In this section, we study the radial flow rates in our simulated barred spiral. Given the limitations of our subgrid model, we use star-forming gas cells to trace the cold gas of the interstellar medium (ISM). Taking into account only these cold gas cells, we split our galaxy into annuli, i.e., polar radial bins, and computed the net radial flow rate for each bin as follows (e.g., Dutta Chowdhury et al. 2024)
 (C.1)
(C.1)
with mi being the mass of a star-forming gas cell within the bounds of the radial bin, ur, i its radial velocity and Δr the extent of the bin in the radial direction. By taking into account only the inflowing (ur, i < 0) or outflowing (ur, i > 0) gas cells, we also derived the inflow, Ṁin, and outflow, Ṁout, rates separately for each radial bin in a similar fashion.
Having derived the radial flow rate for each annulus, we computed integrated values for regions from the center up to each radius r by averaging the radial flow rates of the bins within r. Our reasoning is that in a perfectly steady state flow, a continuous inflow (outflow) rate of cold gas toward the center, would require the same inflow (outflow) rate at all radii from the center up to the edge of a region of interest. Consequently, the same inflow (outflow) rate through the edge of this region would also be required for the steady state picture to be sustained. This is only a crude approximation of the dynamically changing flow rates in a real galaxy, in which, for example, gas can accumulate in different regions invalidating our assumptions. Nevertheless, we used this formulation to get an estimate of the integrated radial flow rates as a function of radius.
We present the results of our computations for a time interval of |Δt|≤ 50Myr around the time of our showcase snapshot in Fig. C.1. We also computed the SFR profiles, derived for each radial bin through the summation of the SFR of all gas cells that fell within its bounds, and present integrated values by summing the SFR of individual annuli up to the radius at hand.
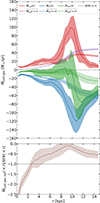 |
Fig. C.1. Simulation: Radial cold gas flow rate and SFR profiles (top) and the ratio of the net flow rate over the SFR as a function of radius (bottom) for a time interval of |Δt|≤ 50Myr from our showcase snapshot. The solid lines show the median outflow (red), inflow (blue) and net (green) flow rate profiles with shaded regions marking the respective ±σ intervals. The dashed lines and respective shaded regions show the median and standard deviation, in a similar manner, of the average radial flow rates and cumulative SFR (purple) from the center up to each radius. The fraction of the integrated radial flow rate over the SFR (brown) up to each radius serves as a measure of the relative effect of each process. We find net radial gas inflow rates of the order of the SFR, with radial gas transport becoming particularly prominent in the bar region, i.e., r≤ 3 kpc. |
We find significant gas streaming at all radii, with the net flow rate being negative, i.e., inflow, essentially across the whole extent of the disk. In particular, the region around 10–12 kpc is characterized by strong converging and diverging flows as well as a high SFR resulting from the accumulation of the cooling gas from the hot halo. Our steady state, radially averaged flow rates, indicate an overall prevalence of converging flows, of the same order of magnitude as the SFR. The absolute value of the fraction (|Ṁnet|/SFR) increases toward the central regions and especially in the region of the bar, providing hints of efficient funneling of gas toward the very center and subsequent building of central mass concentrations before the gas is depleted by star formation. Indeed, assuming that these streaming motions are sustained, the mass within the central 1 kpc of our simulated galaxy is expected to double within ≈3.8 Gyr.
Appendix D: Bar orientation and length
In this section, we present a way to derive the position angle of the bar in the fiducial, face-on orientation, PAbar, 0, required so that, after the disk is oriented to the specified position angle ϕ0 and inclination i, the apparent PA of the bar in the sky plane is PAbar, as shown in Fig. D.1.
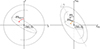 |
Fig. D.1. Illustration of the PA of the bar in the fiducial, face-on orientation (left) and the projection on the sky (right). The bar is required to be along the PAbar, 0 direction shown in the left graph, for its projected position on the plane of the sky to lie along PAbar of the right panel. |
We assume that the disk is razor-thin, the bar is very narrow, and we also neglect its vertical structure (but see also Gadotti et al. 2007). Let the point P(x0, y0, 0) be along the major axis of the bar in the fiducial, face-on orientation. The position angle of this point, PAbar, 0, is given by tan(PAbar, 0) = − x0/y0.
We use a rotation around the y-axis to introduce an inclination, i, and a subsequent rotation around the z-axis to introduce a position angle, ϕ0, realized through the use of the following rotation matrices
 (D.1)
(D.1)
The resulting coordinates of the point P after the inclination i and position angle ϕ0 are
 (D.2)
(D.2)
with the corresponding observed PA of the bar in the plane of the sky being
 (D.3)
(D.3)
Solving the above equation for tan(PAbar, 0) we get the following expression for the PA of the bar in the fiducial, face-on orientation
![Mathematical equation: $$ \begin{aligned} \tan (\mathrm{PA}_{\mathrm{bar,0}})=\frac{\tan (\mathrm{PA}_{\mathrm{bar}})-\tan \phi _0}{[\tan (\mathrm{PA}_{\mathrm{bar}})\tan \phi _0+1]\cos i}=\frac{\tan (\Delta \mathrm{PA})}{\cos i}, \end{aligned} $$](/articles/aa/full_html/2025/12/aa55430-25/aa55430-25-eq31.gif) (D.4)
(D.4)
with ΔPA = PAbar − ϕ0, i.e., ΔPA being the angular difference between the PA of the bar and the disk.
Letting the point P(x0, y0, 0) be located at the end of the bar, its distance from the center in the face-on orientation corresponds to the semimajor axis of the bar, i.e.,  , while its projection on the sky plane corresponds to the observed bar semimajor axis, i.e.,
  . Dividing the former (intrinsic) by the latter (projected) and using Eq. (D.4), the in-plane semimajor axis of the bar is derived as follows (see also Appendix B of Yu et al. 2022)
 (D.5)
(D.5)
Appendix E: Radial and tangential contributions to the LOS velocity residuals
In this section, we review the analysis carried out in Warner et al. (1973), van der Kruit & Allen (1978) and re-derive the LOS contributions of the radial and tangential components of planar velocities. In our case, however, the resulting equations are given as a function of the azimuthal angle ϕ in the plane of the sky, facilitating their application to the interpretation of observational data. To that end, some “rules of thumb” are also derived.
We assume a razor-thin disk and an absence of motions perpendicular to its plane and carry out computations on a per particle (pixel) basis, in the sense that the LOS contributions from a single element of the disk are studied. This analysis can be generalized and applied iteratively to all disk elements.
We derive the positions of the particles (pixels) of the disk in the fiducial, face-on orientation. With i being an inclination estimation without taking into account any second-order effects, i.e., 0 ≤ i ≤ π/2, the actual value to be used so that our conventions are followed is
 (E.1)
(E.1)
 (E.2)
(E.2)
E.1. Radial and tangential velocities
We derive the radial and tangential components of the velocities of disk elements. A 3D right-handed system is used, so that  . At the location of a point P(r, θ, 0), the unit radial
  and tangential
  vectors are
 (E.3)
(E.3)
with respective Cartesian expressions, given the Cartesian coordinates of the point P, i.e.,  , being
 (E.4)
(E.4)
 (E.5)
(E.5)
The use of Cartesian coordinates is convenient for deriving the LOS velocity contributions as the line of sight can be assumed to be along the z-axis. On the contrary, it is more convenient to use to the polar coordinates (r, θ) to refer to different regions of the disk. Thus, we use a mixed formulation, sticking with a Cartesian coordinate system but continuing to use the radius r and angle θ in our equations.
In that context, with the amplitudes of the radial and tangential velocities of disk elements being
 (E.6)
(E.6)
we write the radial and tangential velocities, defined as  and
and  , respectively, as
 (E.7)
(E.7)
 (E.8)
(E.8)
E.2. LOS velocities
We orient the disk to the desired inclination and position angle through the use of the rotation matrices in Eq. (D.1), first applying the inclination matrix to the positions and velocities of the disk elements
 (E.9)
(E.9)
 (E.10)
and then, also applying the PA matrix to the inclined vectors
 (E.11)
 (E.12)
 (E.13)
Assuming the absence of vertical motions, the total LOS velocity is the sum of the LOS contributions of the in-plane radial and tangential velocities. These contributions, assuming that an observer sits at the positive part of the z-axis with a LOS vector of  , and using the Cartesian expression of the in-plane velocities of Eqs. (E.12,E.13), are
 (E.14)
 (E.15)
 (E.16)
E.3. A more convenient angle
Up to this point we have been using the polar coordinate θ of the disk point in the fiducial, face-on orientation. We replace it with the angle ψ with respect to the axis around which the galaxy is inclined, still in the fiducial orientation. Since  , we can convert between the two angles by using
 (E.17)
Once the inclination is considered, the angle of the projected point, with respect to the inclination axis, will differ from ψ. Let ϕ be the respective angle in the projected (sky) xy-plane. This angle is essentially the offset of the projection of the point from the axis of the PA, i.e., the major kinematic axis. A sketch of the three angles used in this section is presented in Fig. E.1.
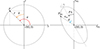 |
Fig. E.1. Illustration of the three angles θ, ψ, and ϕ used in determining the position of a patch of the disk. The angle ϕ, i.e., the angle of the projected position of the patch with respect to the PA axis, is the most convenient one for application to observations, since it is directly observable. |
Plugging Eqs. (E.17) into Eq. (E.9) we get
 (E.18)
 (E.19)
 (E.20)
 (E.21)
Since we would like to replace ψ with ϕ, it is useful to write cos ψ and sin ψ solely as a function of ϕ. To that end, we compute [(E.19/cos i)2 + E.202] getting
 (E.22)
Combining Eqs. (E.19,E.20, and E.22), we have
 (E.23)
 (E.24)
In order to simplify the above expressions, we define the following function
 (E.25)
In physical terms, the function f(ϕ, i) is the ratio of the apparent distance of a point of the disk from the center, in the projected xy-plane, after the inclination is applied over the distance from the center in the fiducial orientation, that is
 (E.26)
The angle ϕ is used from this point on. If the y-axis is used as a reference instead, i.e., the northern direction in the case of an observation, the angle ϕ can be derived using the PA of the projected point ϕ′ and the angle of the PA axis ϕ0, as ϕ = ϕ′−ϕ0.
E.4. LOS velocity residuals
We consider any motions in excess to the axisymmetric rotation as perturbations. In this context, any radial motions as well as any deviation from an azimuthally constant rotation is a perturbation. Thus, while the total radial velocity ur remains unaffected, the total tangential velocity becomes  .
.
The LOS velocity residuals derived by subtracting the LOS contribution of the axisymmetric velocity field from the total one, as a function of the aforementioned angles θ, ψ and ϕ, are
 (E.27)
E.4.1. Contributions of radial velocities
As derived in Sect. E.2 and E.4, the LOS component of the in-plane radial velocities, ur, is given by
 (E.28)
This equation leads to the following conclusions:
-
The contribution of the in-plane radial velocities ur to the residuals is:
-
maximum, along the minor kinematic axis
-
zero, along the major kinematic axis
-
-
If we split the image of the galaxy in quadrants, starting from the approaching side of the major kinematic axis and in the direction of the rotation of the galaxy, in the first two quadrants:
-
inflows cause positive residuals
-
outflows cause negative residuals
The opposite is true for the third and fourth quadrants.
-
E.4.2. Contributions of tangential perturbations
As derived in Sect. E.2 and E.4, the LOS component of the perturbations duθ to the in-plane tangential velocities is given by
 (E.29)
This equation leads to the following conclusions:
-
The contribution of the perturbations duθ to the in-plane tangential velocities to the residuals is:
-
maximum, along the major kinematic axis
-
zero, along the minor kinematic axis
-
-
A slower rotation (i.e., duθ < 0) will cause positive residuals in the approaching side and negative residuals in the receding side. The opposite is true for a faster rotation (i.e., duθ > 0).
E.4.3. Radial and tangential LOS velocity residuals
We compare the LOS contributions of the in-plane radial and tangential velocities by diving Eq. (E.28) by Eq. (E.29), getting
 (E.30)
This relation leads to the following conclusions:
-
The in-plane radial velocities ur do not contribute to the residuals along the major kinematic axis while the in-plane tangential velocity perturbations duθ do not contribute to the residuals along the minor kinematic axis. Thus, any residuals along the major kinematic axis stem exclusively from the perturbations to the in-plane tangential velocities, while any residuals along the minor kinematic axis stem exclusively from the perturbations to the in-plane radial velocities.
-
If we split the image of the galaxy in quadrants, any residuals from slower rotation (e.g., shocks) will have the same sign as:
-
inflows, at the leading side of the major kinematic axis with respect to the rotation of the galaxy
-
outflows, at the trailing side
The opposite is true for faster rotation.
-
E.4.4. Decomposition of LOS velocity residuals
Assuming that the fraction between the in-plane radial and tangential velocity perturbations can be constrained, for instance, through simulations or analytical models, we use the framework of Sect. E.4.3 to decompose the residual velocities into the contributions of the in-plane radial and tangential components.
With ℛ = ur/duθ being the ratio between these components, we use Eq. (E.30) in addition to the fact that the total residual velocities are the sum of the two, i.e., uLOS, resid = ur, LOS + duθ, LOS, to get
 (E.31)
 (E.32)
We combine these equations with Eqs. (E.28 and E.29) to get the in-plane radial and tangential velocities
 (E.33)
 (E.34)
Finally, with the residual velocity field of a galaxy at hand, we can in principle use Eqs. (E.33 and E.34) to derive the actual in-plane radial and tangential velocity perturbations. While this may seem straight-forward, the ratio, ℛ, which is strongly varying across the disk, has to be known beforehand for the decomposition to be possible, significantly limiting the possible applications to real observational data.
All Tables
All Figures
|
Fig. 1. Observation: Color composite of the JWST NIRCam 0.7–4.4 μm imaging data (left), combined HST V+J+H continuum (middle) and the CO(3–2) integrated line flux from our uniformly weighted NOEMA data overlaid with contours of the smooth-subtracted HST continuum bringing out the bar and spiral structure more prominently (right). In both HST and JWST images, a bar is observed in the form of an elongated structure in the central region of our galaxy. In the outskirts of the disk, the seemingly two-armed spiral pattern observed by HST becomes three-armed with JWST. The CO(3–2) flux is mostly concentrated in the bar region and extends beyond the ends of the bar into the spiral arms region. |
| In the text | |
|
Fig. 2. Observation: Total (first and second from left) and residual (third and fourth from left) velocity (top) and velocity dispersion (bottom) maps. The first and third columns from the left show the results for our uniformly weighted data (FWHM resolution 0 |
| In the text | |
|
Fig. 3. Observation: Integrated CO(3–2) line intensity (left), velocity (middle) and velocity dispersion (right) profiles along the major axis of GN4_32842. The observed values marked with blue circles (orange squares) are extracted from our tapered (uniformly weighted) data product with a spatial resolution of 0 |
| In the text | |
|
Fig. 4. Simulation: Face-on surface density of the stellar component (left) and the cold gas surface density (top middle), in-plane velocity field (top right), amplitude of radial (bottom middle), and tangential (bottom right) velocities. The bar is clearly discernible as an elongated structure in the stellar component, while two narrow regions of increased gas surface density, i.e., dust lane shocks or bar lanes, are located at the leading side of the bar. The identified gas flows in this gas-rich barred galaxy are in agreement with theoretical expectations; gas gets shocked at the loci of the bar lanes formed ahead, with respect to the direction of rotation, of the potential minimum, i.e., the major axis of the bar, loses angular momentum and gets funneled toward the center of the galaxy. This pattern is reflected in the radial and tangential components of the in-plane velocities, with a characteristic quadrupole pattern in the former and slower (faster) rotation along the major (minor) axis of the bar in the latter. |
| In the text | |
|
Fig. 5. Simulation: Projected stellar surface density of our simulation oriented similarly as GN4_32842 (left) and Fourier amplitudes of the stellar mass surface density in the face-on orientation (right). In the stellar surface density plot the overlaid contours trace the projected cold gas distribution and the scalebar indicates the size of 1 |
| In the text | |
|
Fig. 6. Simulation: LOS velocities of the cold gas (first from left), the LOS contributions of the radial (second from left) and perturbations to the tangential (third from left) components of the in-plane velocities of the star-forming gas particles, as well as the total LOS residual velocities (fourth from left). The scalebars indicate the size of 0 |
| In the text | |
|
Fig. 7. Comparison between the observed LOS velocity residuals (top and bottom left) and the expected residuals from the simulation (middle), derived as the combined LOS contribution of the radial (top right), and residual tangential (bottom left) planar velocities. The solid and dashed lines indicate the PA of the galaxy and the bar, respectively. There is an apparent qualitative agreement between the simulated and observed residual patterns. Our high-resolution uniformly weighted data capture in detail the gas streaming motions on the southern part of the bar, with respect to the center of the galaxy, while the tapered weighted data enable the additional identification of the outflows at its northern trailing part (and possibly the effect of the northern dust lane shock at the leading one). Insights from the in-plane radial and tangential LOS contributions uncover the nature of planar flows in GN4_32842: faster (slower) azimuthal streaming along the minor (major) axis of the bar, outflows at the trailing side of its major axis, and inflows at the leading one with their observational signatures being damped due to their proximity to the kinematic major axis and opposite contributions stemming from faster azimuthal streaming. |
| In the text | |
|
Fig. A.1. Observation: Ellipticity and position angle (PA) of the fitted elliptical isophotes as a function of their semimajor axis (SMA) (left) and the image of the galaxy in the NIRCam F444W filter (right). The masked regions excluded from the isophote fitting analysis are shown with dimmer colors while the isophotes, and their respective properties, for which formal convergence was not reached are plotted with semi-transparent colors. The observed bar radius is constrained using the peak of the ellipticity profile, located at ≈ 0 |
| In the text | |
|
Fig. C.1. Simulation: Radial cold gas flow rate and SFR profiles (top) and the ratio of the net flow rate over the SFR as a function of radius (bottom) for a time interval of |Δt|≤ 50Myr from our showcase snapshot. The solid lines show the median outflow (red), inflow (blue) and net (green) flow rate profiles with shaded regions marking the respective ±σ intervals. The dashed lines and respective shaded regions show the median and standard deviation, in a similar manner, of the average radial flow rates and cumulative SFR (purple) from the center up to each radius. The fraction of the integrated radial flow rate over the SFR (brown) up to each radius serves as a measure of the relative effect of each process. We find net radial gas inflow rates of the order of the SFR, with radial gas transport becoming particularly prominent in the bar region, i.e., r≤ 3 kpc. |
| In the text | |
|
Fig. D.1. Illustration of the PA of the bar in the fiducial, face-on orientation (left) and the projection on the sky (right). The bar is required to be along the PAbar, 0 direction shown in the left graph, for its projected position on the plane of the sky to lie along PAbar of the right panel. |
| In the text | |
|
Fig. E.1. Illustration of the three angles θ, ψ, and ϕ used in determining the position of a patch of the disk. The angle ϕ, i.e., the angle of the projected position of the patch with respect to the PA axis, is the most convenient one for application to observations, since it is directly observable. |
| In the text | |
Current usage metrics show cumulative count of Article Views (full-text article views including HTML views, PDF and ePub downloads, according to the available data) and Abstracts Views on Vision4Press platform.
Data correspond to usage on the plateform after 2015. The current usage metrics is available 48-96 hours after online publication and is updated daily on week days.
Initial download of the metrics may take a while.