Fig. 3.
Download original image
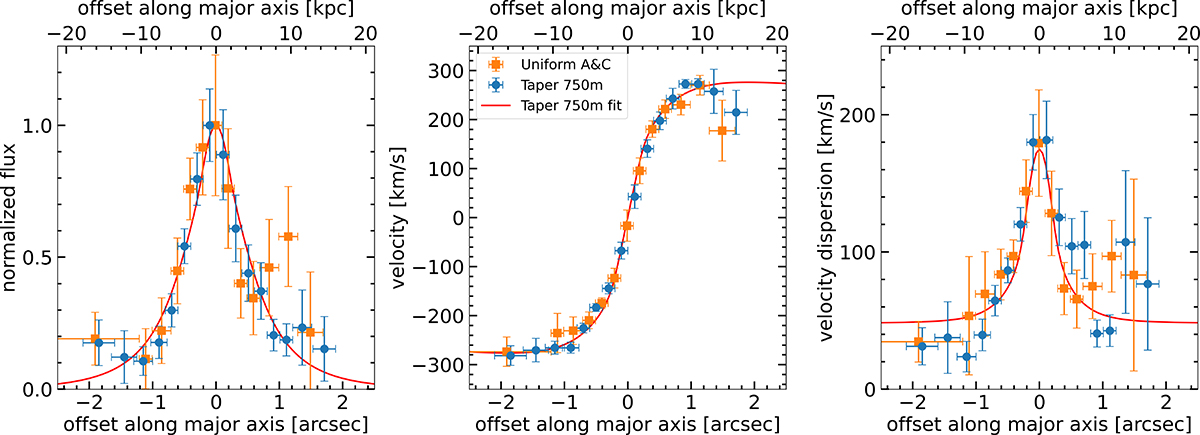
Observation: Integrated CO(3–2) line intensity (left), velocity (middle) and velocity dispersion (right) profiles along the major axis of GN4_32842. The observed values marked with blue circles (orange squares) are extracted from our tapered (uniformly weighted) data product with a spatial resolution of 0![]() 57 (0
57 (0![]() 36), while the respective best-fit model for our tapered data, better capturing the extended emission, is plotted with a red line.
36), while the respective best-fit model for our tapered data, better capturing the extended emission, is plotted with a red line.
Current usage metrics show cumulative count of Article Views (full-text article views including HTML views, PDF and ePub downloads, according to the available data) and Abstracts Views on Vision4Press platform.
Data correspond to usage on the plateform after 2015. The current usage metrics is available 48-96 hours after online publication and is updated daily on week days.
Initial download of the metrics may take a while.