Fig. 5.
Download original image
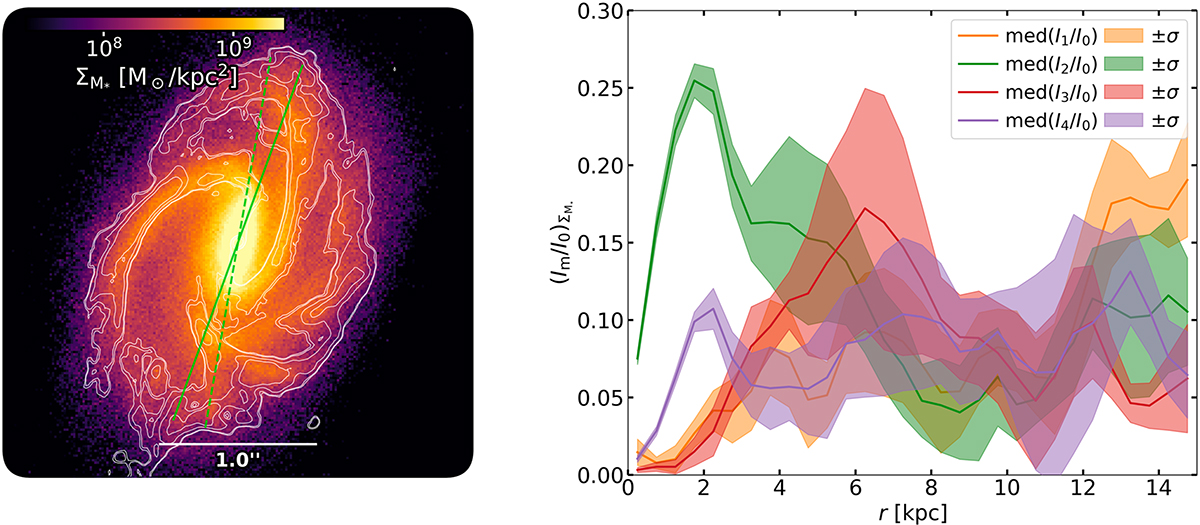
Simulation: Projected stellar surface density of our simulation oriented similarly as GN4_32842 (left) and Fourier amplitudes of the stellar mass surface density in the face-on orientation (right). In the stellar surface density plot the overlaid contours trace the projected cold gas distribution and the scalebar indicates the size of 1![]() 0 at z ≈ 1.52. The solid and dashed green lines indicate the PA of the galaxy and the bar, respectively. In the Fourier amplitude profiles, solid lines indicate the median profiles from the decompositions of snapshots within |Δt|≤50 Myr from the one used in our analysis, while shaded regions mark the ±1σ interval around these median values. The central region is consistently dominated by an m = 2 component extending up to ≈5 kpc, with little scatter in the amplitudes of both m = 2 and m = 4 up to ≈3 kpc marking the radius of the bar. Moving outwards, a dominant m = 3 component is found, succeeded by m = 4 at larger radii and m = 1 at the very outskirts of the disk.
0 at z ≈ 1.52. The solid and dashed green lines indicate the PA of the galaxy and the bar, respectively. In the Fourier amplitude profiles, solid lines indicate the median profiles from the decompositions of snapshots within |Δt|≤50 Myr from the one used in our analysis, while shaded regions mark the ±1σ interval around these median values. The central region is consistently dominated by an m = 2 component extending up to ≈5 kpc, with little scatter in the amplitudes of both m = 2 and m = 4 up to ≈3 kpc marking the radius of the bar. Moving outwards, a dominant m = 3 component is found, succeeded by m = 4 at larger radii and m = 1 at the very outskirts of the disk.
Current usage metrics show cumulative count of Article Views (full-text article views including HTML views, PDF and ePub downloads, according to the available data) and Abstracts Views on Vision4Press platform.
Data correspond to usage on the plateform after 2015. The current usage metrics is available 48-96 hours after online publication and is updated daily on week days.
Initial download of the metrics may take a while.