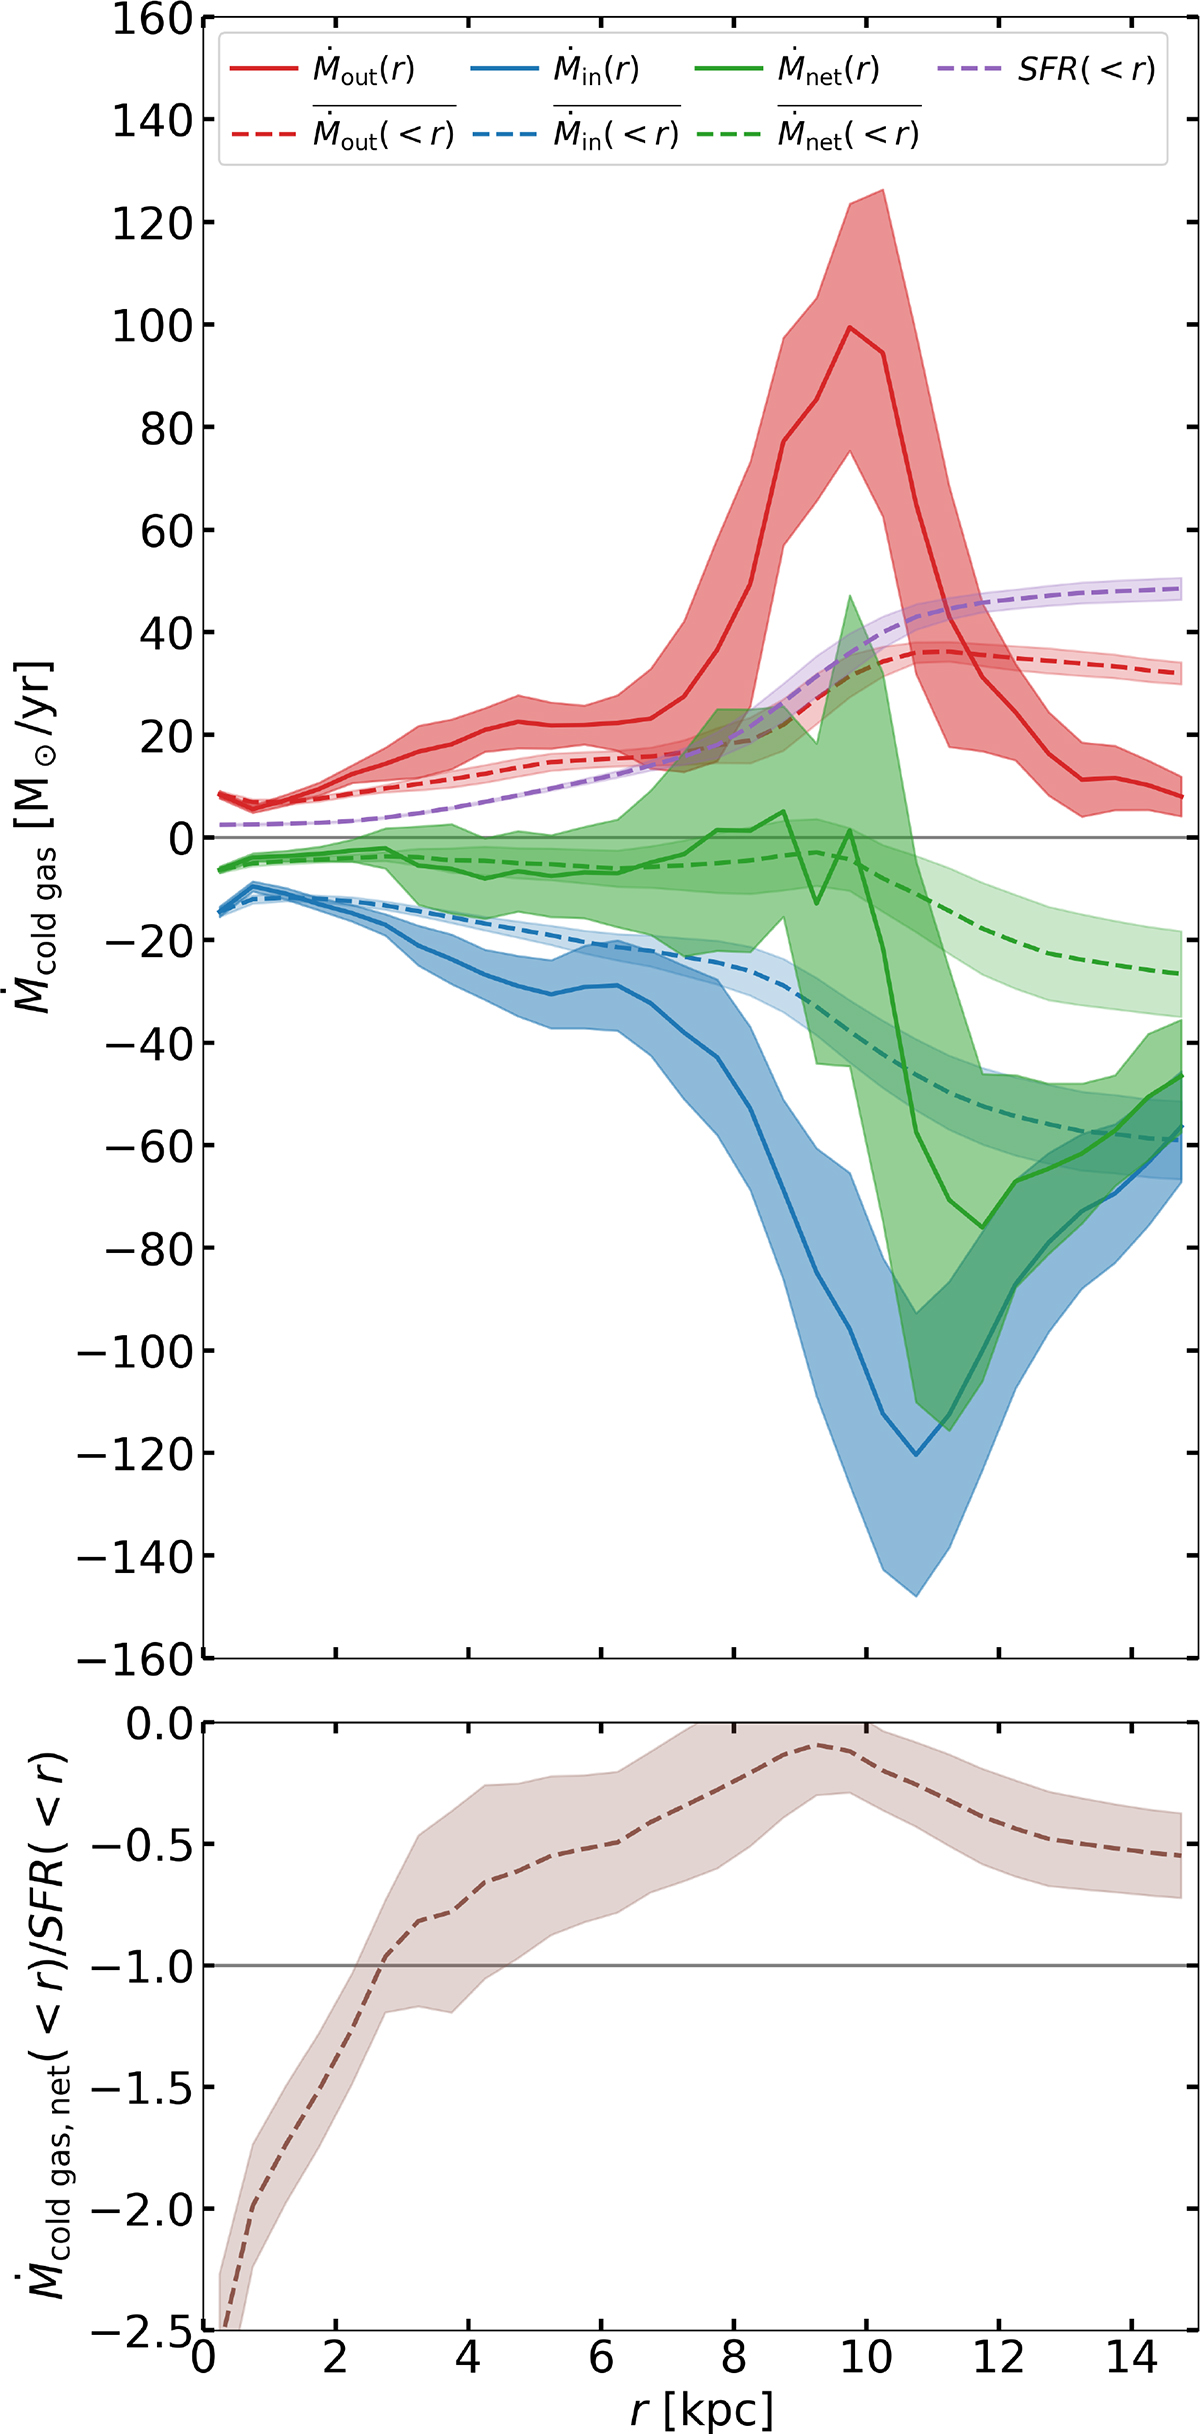
Fig. C.1.
Download original image
Simulation: Radial cold gas flow rate and SFR profiles (top) and the ratio of the net flow rate over the SFR as a function of radius (bottom) for a time interval of |Δt|≤ 50Myr from our showcase snapshot. The solid lines show the median outflow (red), inflow (blue) and net (green) flow rate profiles with shaded regions marking the respective ±σ intervals. The dashed lines and respective shaded regions show the median and standard deviation, in a similar manner, of the average radial flow rates and cumulative SFR (purple) from the center up to each radius. The fraction of the integrated radial flow rate over the SFR (brown) up to each radius serves as a measure of the relative effect of each process. We find net radial gas inflow rates of the order of the SFR, with radial gas transport becoming particularly prominent in the bar region, i.e., r≤ 3 kpc.
Current usage metrics show cumulative count of Article Views (full-text article views including HTML views, PDF and ePub downloads, according to the available data) and Abstracts Views on Vision4Press platform.
Data correspond to usage on the plateform after 2015. The current usage metrics is available 48-96 hours after online publication and is updated daily on week days.
Initial download of the metrics may take a while.