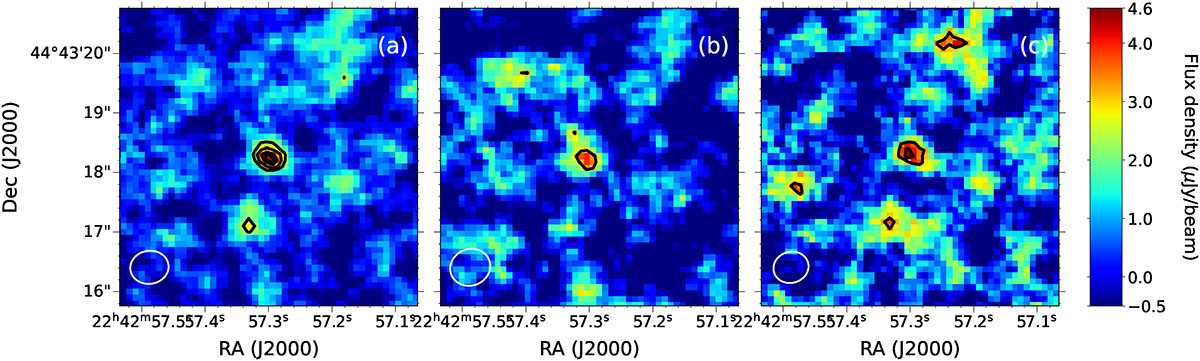
Fig. 1.
Download original image
MWC 656, as detected by combining all eight observed epochs in X band with VLA. (a) Image of full X band. (b) Image of LSB of X band, from 8.0 to 10.0 GHz. (c) Image of USB of X band, from 10.0 to 12.0 GHz. Contour levels are −3.0, 3.0, 4.0, 5.0, and 5.4 the noise level of each image as listed in Table 1. The synthesized beam size, also as listed in Table 1, is shown as a white ellipse in the bottom left of each panel.
Current usage metrics show cumulative count of Article Views (full-text article views including HTML views, PDF and ePub downloads, according to the available data) and Abstracts Views on Vision4Press platform.
Data correspond to usage on the plateform after 2015. The current usage metrics is available 48-96 hours after online publication and is updated daily on week days.
Initial download of the metrics may take a while.