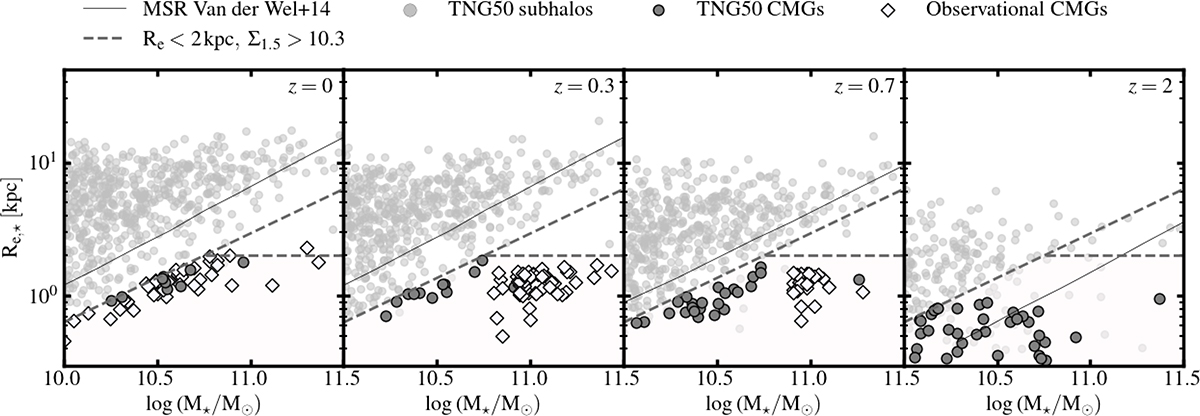
Fig. 1.
Download original image
Stellar mass–size relation across redshift bins. All TNG50 subhalos are shown as light gray circles in the background, while selected compact subhalos are represented by dark gray circles. Observational CMGs from the different samples are indicated with white diamond markers. The solid black lines follow the mass–size relation from van der Wel et al. (2014), while the dashed gray lines highlight the selection region for the simulated sample (Re < 2 kpc, log Σ1.5 > 10.3 dex).
Current usage metrics show cumulative count of Article Views (full-text article views including HTML views, PDF and ePub downloads, according to the available data) and Abstracts Views on Vision4Press platform.
Data correspond to usage on the plateform after 2015. The current usage metrics is available 48-96 hours after online publication and is updated daily on week days.
Initial download of the metrics may take a while.