Fig. 4.
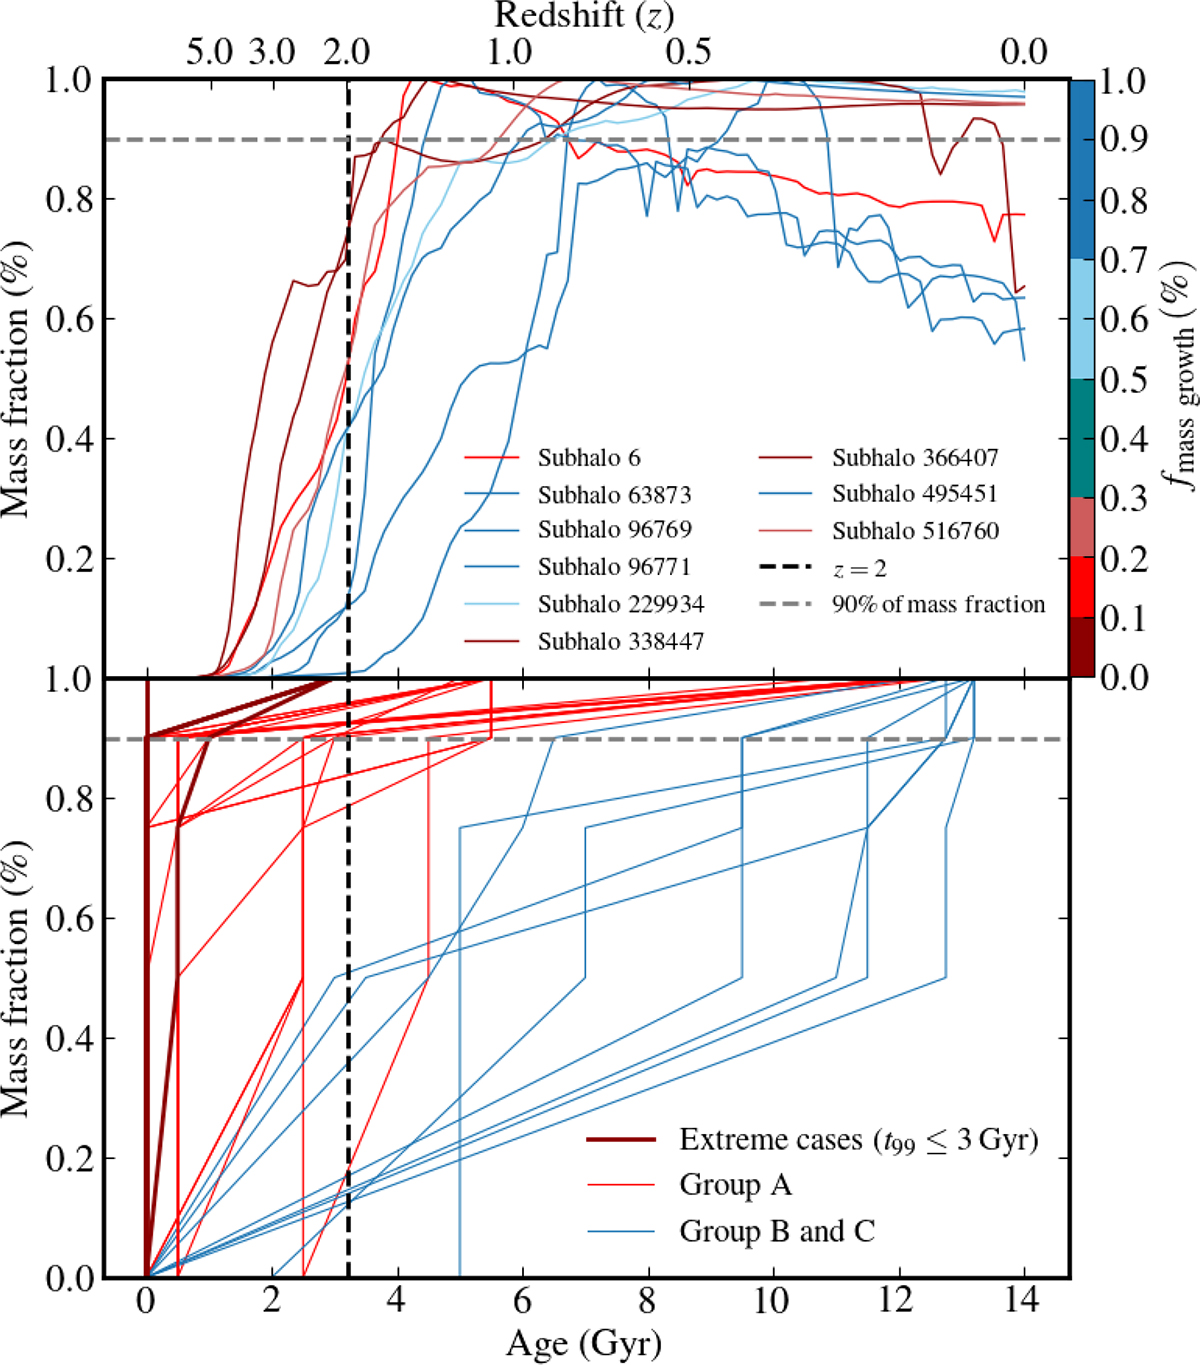
Download original image
Stellar mass assembly for the simulated and observed samples at z = 0. The upper panel shows the stellar mass fraction over time for each compact subhalo selected from TNG50, color-coded by the stellar mass growth fraction since z = 2. The lower panel shows the stellar mass assembly over time for the MaNGA compact galaxies of Grèbol-Tomàs et al. (2023), color-coded by group: blue represents Groups B and C, which show extended and/or late SFHs; red represents galaxies in their Group A, which exhibit early and rapid formation (and thus negligible accretion after z = 2); dark red indicates extreme cases, where the galaxy is fully assembled early on (with < 10% accreted material). In both panels, the dashed vertical black line indicates z = 2 and the dashed horizontal gray line indicates the stellar mass fraction of 90%.
Current usage metrics show cumulative count of Article Views (full-text article views including HTML views, PDF and ePub downloads, according to the available data) and Abstracts Views on Vision4Press platform.
Data correspond to usage on the plateform after 2015. The current usage metrics is available 48-96 hours after online publication and is updated daily on week days.
Initial download of the metrics may take a while.