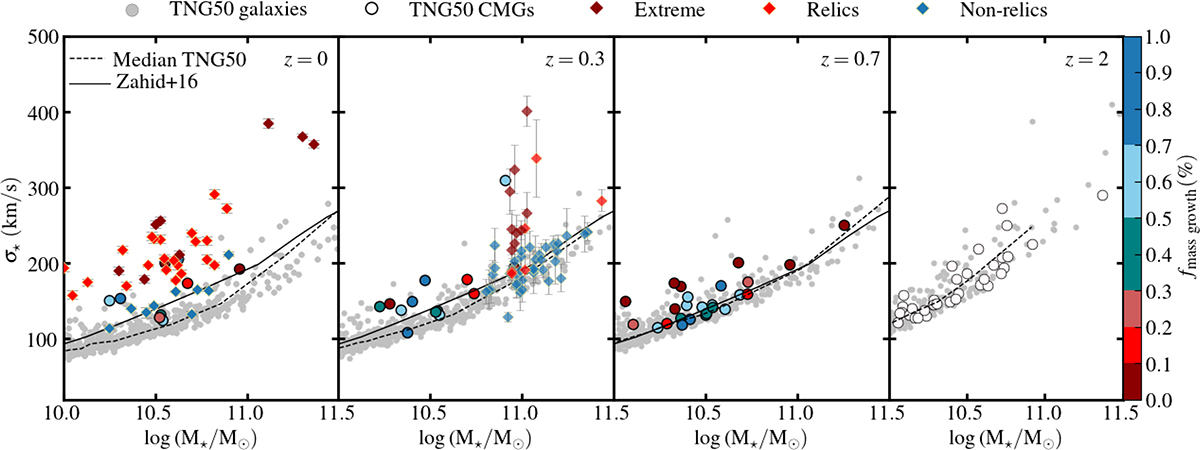
Fig. 5.
Download original image
Stellar mass–stellar velocity dispersion relations for simulated and observed galaxies in the different redshift bins. The dashed black line represents the median σ★ for all TNG50 quiescent subhalos, while the solid black line corresponds to the Zahid et al. (2016) relation across all redshifts. All TNG50 subhalos are shown as gray dots, with the compact sample color-coded by their mass growth since z = 2 (except for the final bin, which is considered he starting point and is therefore left uncolored). Observational data are represented by diamonds, color-coded as follows: dark red for the extreme relics (e.g., extreme cases of group A for MaNGA, DoR > 0.7 for INSPIRE); red for relics (remaining group A of MaNGA and INSPIRE galaxies with 0.5 < DoR < 0.7); and blue for the non-relic group (classes B and C of MaNGA, DoR < 0.5 for INSPIRE).
Current usage metrics show cumulative count of Article Views (full-text article views including HTML views, PDF and ePub downloads, according to the available data) and Abstracts Views on Vision4Press platform.
Data correspond to usage on the plateform after 2015. The current usage metrics is available 48-96 hours after online publication and is updated daily on week days.
Initial download of the metrics may take a while.