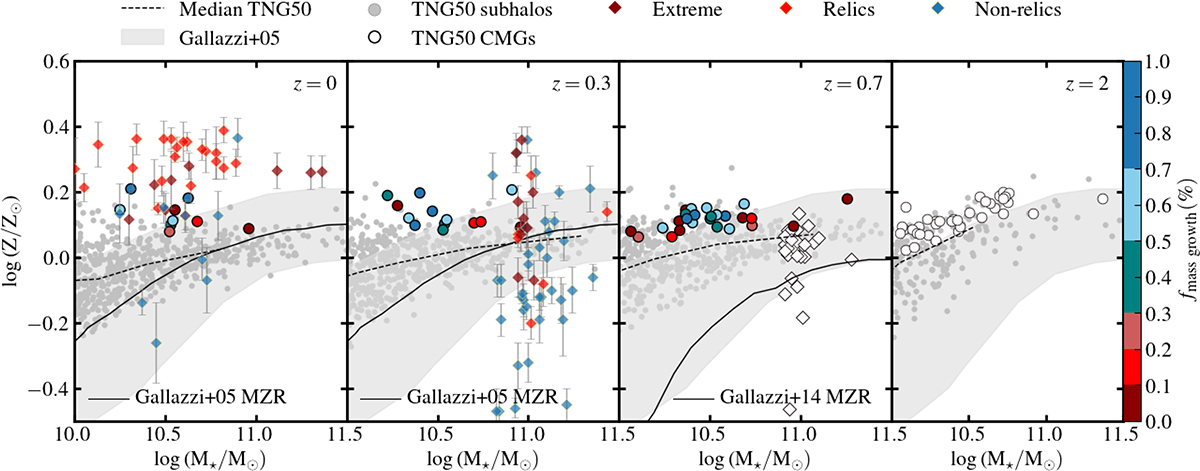
Fig. 6.
Download original image
Stellar mass – total stellar metallicity for simulated and observed galaxies. Symbols and colors are as in Fig. 5. A shift of −0.2 dex was applied to the stellar metallicities of simulated subhalos following Nelson et al. (2019). The dashed black line indicates the median stellar metallicity of quiescent subhalos in TNG50. Shaded regions correspond to the local stellar metallicity relations from Gallazzi et al. (2005); the solid black line follows Gallazzi et al. (2005) for z = 0 and z = 0.3, and Gallazzi et al. (2014) for z = 0.7. Observed relics are more metal-rich than other compact galaxies, deviating from the local mass–metallicity relation, while simulated compact galaxies are consistently more metal-rich than the quiescent population, independent of their SFHs.
Current usage metrics show cumulative count of Article Views (full-text article views including HTML views, PDF and ePub downloads, according to the available data) and Abstracts Views on Vision4Press platform.
Data correspond to usage on the plateform after 2015. The current usage metrics is available 48-96 hours after online publication and is updated daily on week days.
Initial download of the metrics may take a while.