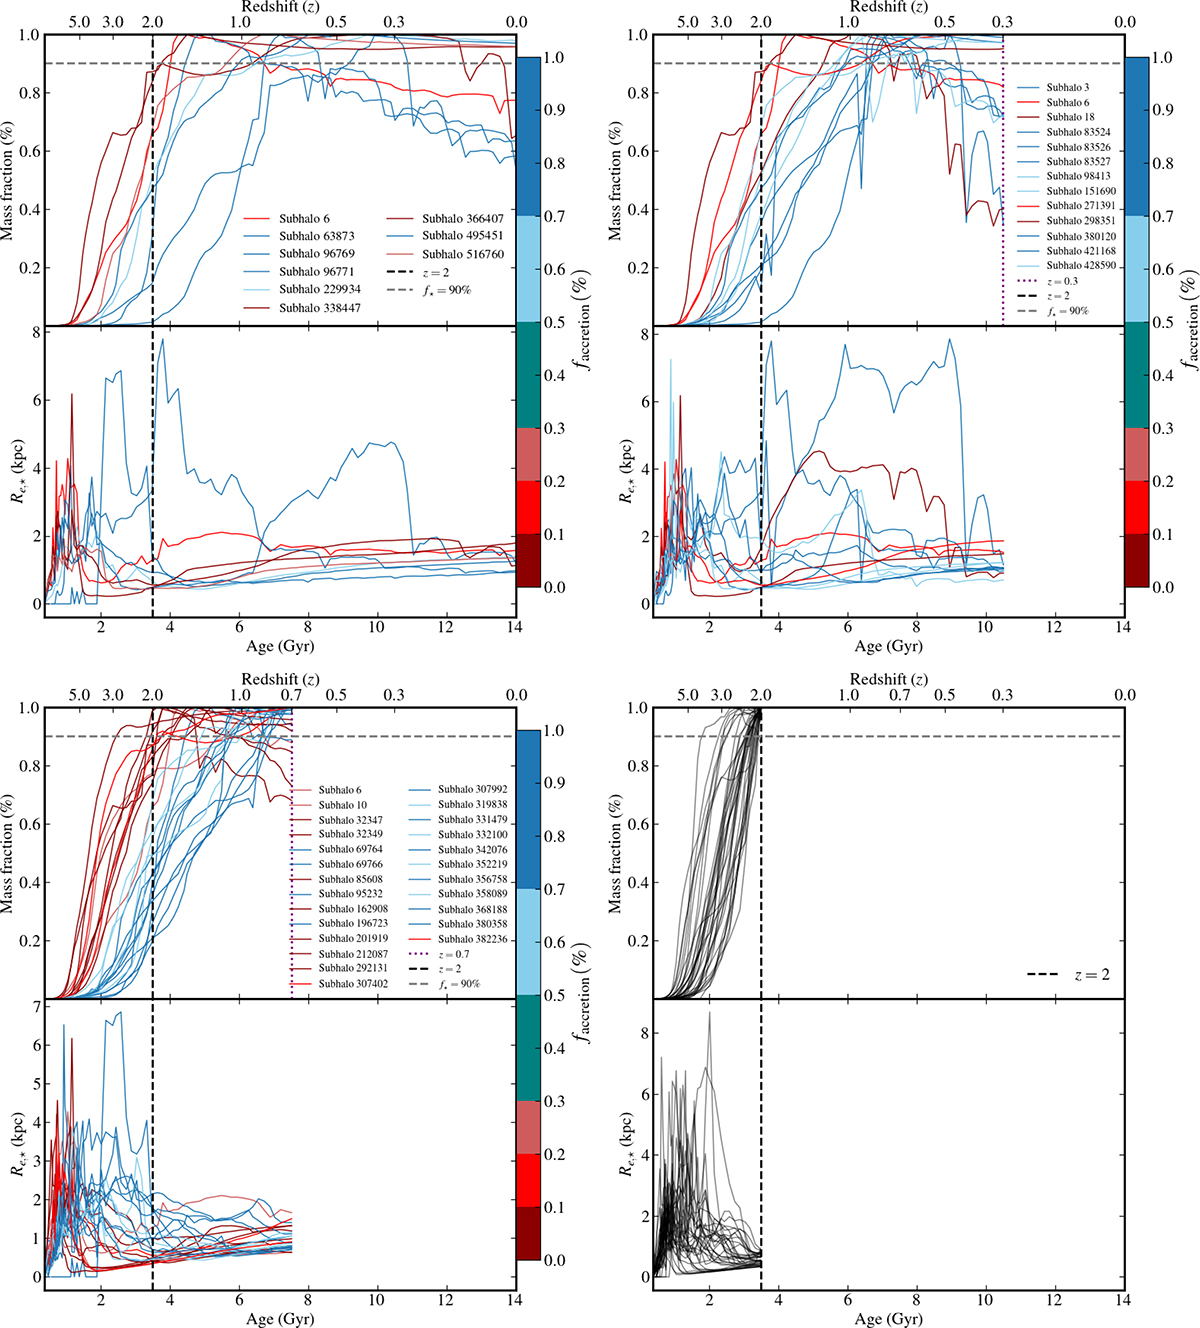
Fig. A.2.
Download original image
Stellar mass and size assembly of simulated compact galaxies at four redshifts: z = 0 (upper left), z = 0.3 (upper right), z = 0.7 (lower left), and z = 2 (lower right). Each panel displays the evolution of stellar mass fraction and effective radius over time. All panels are color-coded by the stellar mass accreted since z = 2, except for the z = 2 panel, which remains uncolored. The vertical dashed black line marks z = 2, while the dashed purple line indicates the redshift corresponding to each sample. The horizontal grey line denotes the 90% stellar mass fraction threshold at the given redshift.
Current usage metrics show cumulative count of Article Views (full-text article views including HTML views, PDF and ePub downloads, according to the available data) and Abstracts Views on Vision4Press platform.
Data correspond to usage on the plateform after 2015. The current usage metrics is available 48-96 hours after online publication and is updated daily on week days.
Initial download of the metrics may take a while.