Fig. 1.
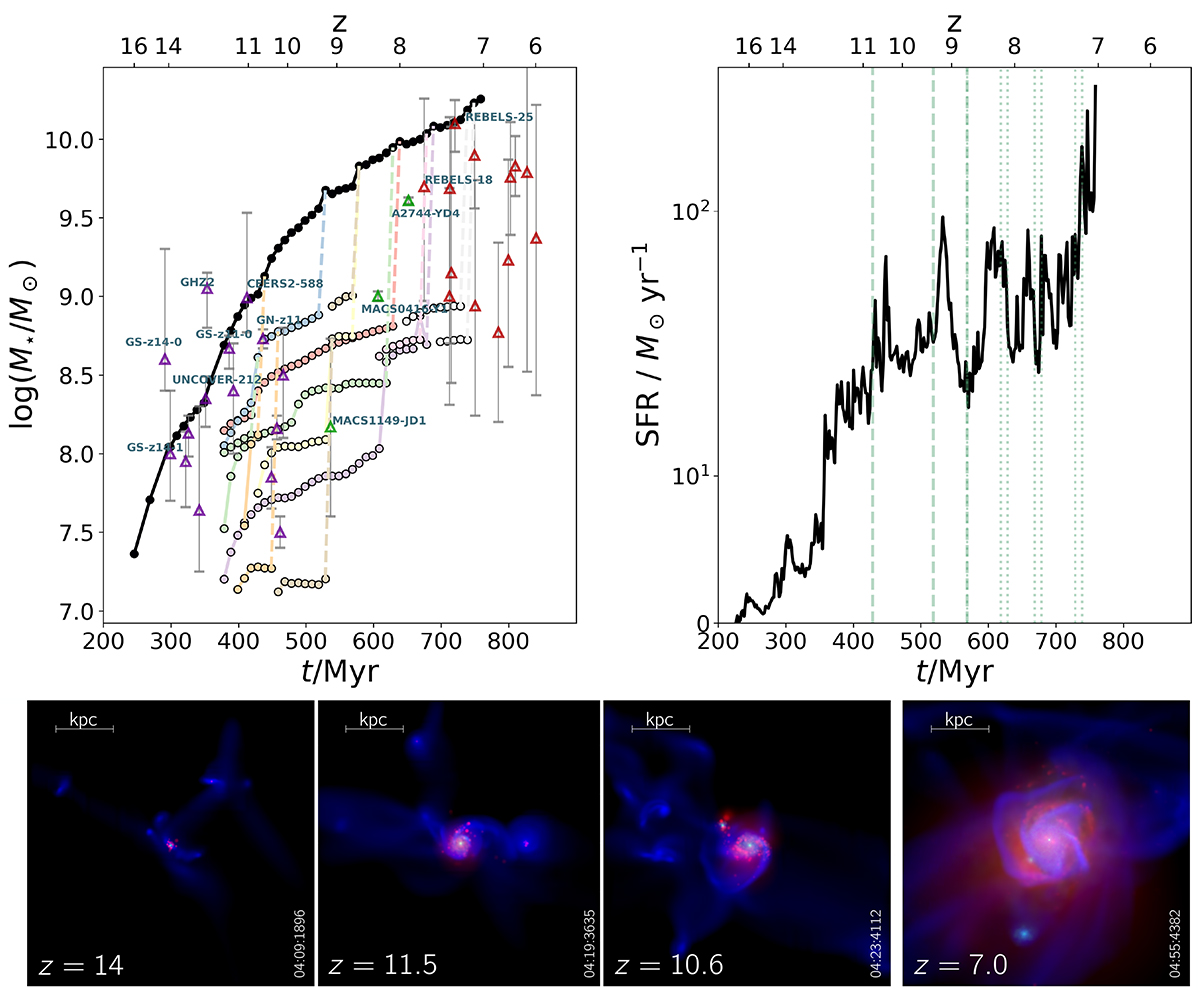
Download original image
Overview of “Amaryllis”, a digital twin of early galaxies. Upper-left panel: Merger history of Amaryllis. Each curve shows the stellar mass (M★) of the progenitors as a function of cosmic time (t), with the corresponding redshift (z) on the upper axis. The black line indicates the main galaxy, while each colored line represents a merging satellite. Solid lines mark the phases during which each system remains distinct, and dashed lines highlight the mergers. The observational measurements shown include massive z > 10 galaxies, spectroscopically confirmed by JWST (violet triangles; Ferrara et al. 2025, Table 1), z ∼ 6 − 9 galaxies from CEERS and COSMOS (green triangles; Harikane et al. 2024), and REBELS sources (red triangles; Dayal et al. 2022, Table 2). Upper-right panel: SFH of Amaryllis throughout cosmic time, with vertical lines corresponding to minor (dotted) and major (dashed) merger events. Bottom panels: Composite images at four evolutionary stages, built from the stellar surface density (Σ★), gas surface density (Σgas), and the Habing field intensity (G).
Current usage metrics show cumulative count of Article Views (full-text article views including HTML views, PDF and ePub downloads, according to the available data) and Abstracts Views on Vision4Press platform.
Data correspond to usage on the plateform after 2015. The current usage metrics is available 48-96 hours after online publication and is updated daily on week days.
Initial download of the metrics may take a while.