| Issue |
A&A
Volume 704, December 2025
|
|
|---|---|---|
| Article Number | A39 | |
| Number of page(s) | 11 | |
| Section | Astrophysical processes | |
| DOI | https://doi.org/10.1051/0004-6361/202555499 | |
| Published online | 16 December 2025 | |
Amaryllis: A digital twin of the earliest galaxies in the Universe
1
Scuola Normale Superiore, Piazza dei Cavalieri 7, I-56126 Pisa, Italy
2
Dipartimento di Fisica “Enrico Fermi”, Universitá di Pisa, Largo Bruno Pontecorvo 3, I-56127 Pisa, Italy
★ Corresponding author This email address is being protected from spambots. You need JavaScript enabled to view it.
Received:
13
May
2025
Accepted:
8
September
2025
Abstract
Synergies between JWST and ALMA are unveiling a population of bright, super-early galaxies (z > 10), including systems like GS-z14-0 (z = 14.2) and GHZ2 (z = 12.3) with extreme far-infrared (FIR) line ratios ([OIII] 88 μm/[CII] 158 μm > 3) that challenge galaxy formation models. To address this, we identified a synthetic analog of these sources, “Amaryllis”, within the SERRA zoom-in simulations and tracked its evolution from z = 16 to z = 7. During this period, Amaryllis grows from log(M★/M⊙)∼7.4 to 10.3, linking super-early progenitors to the massive galaxy population at the end of reionization. At z ∼ 11.3, Amaryllis closely matches the observed properties of GS-z14-0, including the M★, star formation rate, and the luminosity of FIR ([OIII] 88 μm) and UV (e.g., CIII]1908) lines. We find high [OIII]/[CII] ratios during short, merger-driven starburst episodes, when low metallicity (Z ∼ 0.1 Z⊙) and high ionization conditions (Uion ∼ 0.3) push the interstellar medium far from equilibrium. These extreme FIR line ratios are thus transient and linked to major mergers that ignite strong ionized gas outflows. Strikingly, despite this dynamical activity, Amaryllis develops a rotation-supported gaseous disk (V/σ ∼ 4 − 6) by z ∼ 11, while stars remain dispersion-dominated. This coexistence of ordered gas rotation and merger-driven disturbances occurs within a massive yet typical Λ cold dark matter halo, enabling disk formation even at cosmic dawn.
Key words: galaxies: evolution / galaxies: high-redshift / galaxies: kinematics and dynamics / galaxies: structure
© The Authors 2025
 Open Access article, published by EDP Sciences, under the terms of the Creative Commons Attribution License (https://creativecommons.org/licenses/by/4.0), which permits unrestricted use, distribution, and reproduction in any medium, provided the original work is properly cited.
This article is published in open access under the Subscribe to Open model. This email address is being protected from spambots. You need JavaScript enabled to view it. to support open access publication.
1. Introduction
The James Webb Space Telescope (JWST) has led to extraordinary advancements in the study of galaxy formation, particularly at the highest redshifts (z > 10) during cosmic dawn (see Stark et al. 2025, for a review). This previously uncharted epoch marks the emergence of the first stars and galaxies, offering an unprecedented window into early cosmic history. JWST has already uncovered a substantial population of massive (M★ > 108 M⊙) super-early (z > 10) galaxies (Arrabal Haro et al. 2023; Atek et al. 2023; Bunker et al. 2023; Carniani et al. 2024a; Castellano et al. 2024; Curtis-Lake et al. 2023; Finkelstein et al. 2024; Harikane et al. 2024; Hsiao et al. 2024; Wang et al. 2023; Robertson et al. 2023, 2024; Tacchella et al. 2023; Zavala et al. 2025), providing new insights into their assembly histories, star formation activity, and interstellar medium (ISM) conditions.
Building on these discoveries, the Atacama Large Millimeter/Submillimeter Array (ALMA) has been used to investigate fine-structure far-infrared (FIR) cooling lines, such as [O III] 88 μm and [C II] 158 μm (Bakx et al. 2023; Fujimoto et al. 2023; Kaasinen et al. 2023; Popping 2023; Yoon et al. 2023; Schouws et al. 2025a). However, early ALMA follow-ups often resulted in non-detection, particularly for GHZ2 (Castellano et al. 2022; Naidu et al. 2022; Donnan et al. 2022; Harikane et al. 2023) and GHZ1 (Treu et al. 2022; Santini et al. 2023). These outcomes were initially attributed to sensitivity limits and the high cost of spectral scans (Bakx et al. 2023; Kaasinen et al. 2023; Furlanetto & Mirocha 2023) or, in some cases like HD1 (originally at z = 13.3), to misidentifications of low-redshift interlopers at z ∼ 4 (Harikane et al. 2025).
Alongside these observational efforts, theoretical studies using zoom-in cosmological simulations (Kohandel et al. 2023; Nakazato et al. 2023) have investigated the detectability of FIR lines at such high redshifts. For instance, Pallottini et al. (2022) predict a large scatter in [O III] 88 μm luminosity at fixed star formation rates (SFRs) and stellar mass in simulated galaxies. At z > 11, Kohandel et al. (2023) find that many such galaxies lie slightly below the local metal-poor L[OIII]–SFR relation, driven by variations in the ionization parameter (Uion) regulating [O III] emission (see also Vallini et al. 2017; Harikane et al. 2023). These ionizing conditions appear closely tied to morphological and dynamical states: Pallottini et al. (2022) show that Uion correlates with merger stages, galaxy compactness, and H II region sizes. Furthermore, Kohandel et al. (2023) find that transitioning from a clumpy, highly pressurized structure to a more extended, disk-like configuration, where the ionized ISM becomes more diffuse, can significantly boost [O III] emission. Crucially, they predict that detecting [O III] 88 μm emission from ∼109 M⊙ galaxies at z > 11 could require as little as 2.8 hours of ALMA on-source time, provided those galaxies are already dynamically mature and exhibit a disk-like structure.
Such theoretical predictions are supported by recent JWST-ALMA synergies, which have led to the detection of [O III] 88 μm emission in two galaxies at z > 10: JADES-GS-z14-0 (hereafter GS-z14-0; at z = 14.1796, with a 2.8-hour integration time; Carniani et al. 2025; Schouws et al. 2025b), the most distant galaxy with a confirmed spectroscopic redshift, and GHZ2 (at z = 12.3327; Zavala et al. 2024). Both galaxies lie on or slightly below the L[OIII]–SFR relation, consistent with the predictions from SERRA (Kohandel et al. 2023), and show substantial metal enrichment, with gas-phase metallicities estimated at Z ∼ 0.05 − 0.2 Z⊙. Most recently, Pérez-González et al. (2025) report six F200W and three F277W dropout candidates, at z ∼ 17 and z ∼ 25, respectively, which, if confirmed, would seriously challenge standard Λ cold dark matter (ΛCDM)-based galaxy formation models (Matteri et al. 2025).
We used the SERRA simulations to delve more deeply into the assembly history of these super-early galaxies. Our primary aim is to identify and characterize their progenitors, shedding light on their star formation, kinematics, and ISM conditions. By tracing how these galaxies form and evolve over cosmic time, we examined how early in time zoom-in cosmological simulations are able to track such nascent systems, and we assessed whether they could plausibly grow into the massive galaxies observed at z ∼ 6 − 7. Section 2 provides an overview of the SERRA simulations, followed by the introduction of Amaryllis, a digital twin1 of observed z > 10 galaxies, in Sect. 3. In Sect. 4 we examine the evolution of FIR line ratios, while Sect. 5 explores the role of galaxy kinematics in the early Universe. Finally, our conclusions are summarized in Sect. 6.
2. Summary of the SERRA simulations
The SERRA suite of zoom-in simulations (Pallottini et al. 2022) is tailored to study the formation and evolution of early galaxies, from the cosmic dawn epoch (z > 10) to the post-reionization epoch (z ∼ 4). These simulations account for the interaction of radiation, gas, stars, and dark matter (DM) using the adaptive mesh refinement code RAMSES (Teyssier 2002; Rosdahl & Teyssier 2015). Through the zoom-in technique, SERRA follows the formation of galaxies from intergalactic down to molecular cloud scales (≃30 pc at z ∼ 6), which is required to capture small-scale processes such as star formation and feedback within a cosmological context. The model includes chemical nonequilibrium evolution (Grassi et al. 2014; Pallottini et al. 2017a), stellar feedback (Pallottini et al. 2017b), and radiative transfer (Decataldo et al. 2019; Pallottini et al. 2019).
The SERRA project has made significant progress in bridging the gap between simulations and observations by accurately reproducing galaxy properties for direct comparison with current and future observational data (Behrens et al. 2018; Gelli et al. 2020, 2021, 2023, 2025; Kohandel et al. 2019, 2020, 2023; Kohandel et al. 2024; Pallottini et al. 2019, 2022, 2025; Pallottini & Ferrara 2023; Rizzo et al. 2022; Vallini et al. 2018, 2020; Zanella et al. 2021). A key feature is the ability to calculate both line and continuum emission across multiple wavelengths. Line emission is computed using the CLOUDY spectral synthesis code (Ferland et al. 2017), accounting for the turbulent structure of molecular clouds (Vallini et al. 2018; Pallottini et al. 2019). The attenuated UV and FIR continuum emission is modeled through the Monte Carlo radiative transfer code SKIRT (Baes & Camps 2015; Camps & Baes 2015), with dust properties implemented in post-processing (Behrens et al. 2018).
Moreover, SERRA can generate hyperspectral data cubes for key emission lines (Kohandel et al. 2020). These data cubes facilitate detailed spatial and kinematic analysis, capturing emission line profiles and spatial variations, while integrated line strengths enable a direct comparison with observational data (Kohandel et al. 2019, 2024; Rizzo et al. 2022). By modeling both global and spatially resolved emission, SERRA can provide insights into the physical conditions of the ISM in high-redshift galaxies, ensuring that the simulations are well suited for comparison with a wide range of observational datasets.
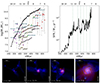 |
Fig. 1. Overview of “Amaryllis”, a digital twin of early galaxies. Upper-left panel: Merger history of Amaryllis. Each curve shows the stellar mass (M★) of the progenitors as a function of cosmic time (t), with the corresponding redshift (z) on the upper axis. The black line indicates the main galaxy, while each colored line represents a merging satellite. Solid lines mark the phases during which each system remains distinct, and dashed lines highlight the mergers. The observational measurements shown include massive z > 10 galaxies, spectroscopically confirmed by JWST (violet triangles; Ferrara et al. 2025, Table 1), z ∼ 6 − 9 galaxies from CEERS and COSMOS (green triangles; Harikane et al. 2024), and REBELS sources (red triangles; Dayal et al. 2022, Table 2). Upper-right panel: SFH of Amaryllis throughout cosmic time, with vertical lines corresponding to minor (dotted) and major (dashed) merger events. Bottom panels: Composite images at four evolutionary stages, built from the stellar surface density (Σ★), gas surface density (Σgas), and the Habing field intensity (G). |
3. Amaryllis: A digital twin of early galaxies
In Kohandel et al. (2023), we identified a sample of 366 super-early (11 ≲ z ≲ 14) SERRA galaxies with M★ ≳ 108 M⊙. From this sample, a subset of 42 galaxies was shown to have 6 ≤ SFR/M⊙ yr−1 ≤ 35, i.e., to match the SFR values observed for super-early candidates by JWST. Galaxies in such a subset reside in DM halos with masses 1010 − 10.7 M⊙ and are classified as starbursts based on their position in the ΣSFR − Σgas plane2. On the L[OIII]–SFR relation, they lie between local metal-poor and local starburst galaxies (De Looze et al. 2014), with ten objects slightly below the metal-poor relation, similar to GS-z14-0 and GHZ2 (see Kohandel et al. 2023, Fig. 1).
3.1. A possible assembly history of super-early galaxies
In this work we focused on “Amaryllis”, the brightest galaxy in that subgroup and representative of that below-relation population. To reconstruct its assembly history, we applied the ROCKSTAR-GALAXIES phase-space clustering algorithm (Behroozi et al. 2013) and tracked its merger history with an approach similar to MERGERTREE (Knebe et al. 2013, see Sect. 2.4.1 of Pallottini et al. 2022 for details) using time steps of Δ ≃ 10 Myr. This method reliably follows the galaxy down to z ∼ 12. At higher redshifts, however, the halo finder becomes unreliable due to the small sizes and irregular dynamical states of early structures. To extend the reconstruction to earlier epochs, we adopted a complementary method: stellar particles associated with the galaxy at lower redshift are tracked back across successive snapshots by matching their unique IDs directly within the simulation outputs. By centering the analysis on the stellar mass distribution and extracting local properties independently of halo catalogs, we can follow the galaxy’s growth down to z ∼ 16, corresponding to its initial formation in the simulation. Figure 1 provides a broad overview of Amaryllis, including (i) its merger history, (ii) star formation history (SFH), and (iii) composite images at four key epochs (z = 14, 11.3, 10.6, and 7.0).
We begin with the merger history of Amaryllis, shown in the upper-left panel of Fig. 1, which traces the stellar mass growth of the main progenitor and its merging companions from z = 16 to z = 7. Starting from log(M★/M⊙) = 7.36 at z = 16, Amaryllis assembles rapidly through a combination of cosmological accretion and hierarchical merging, reaching log(M★/M⊙) = 10.26 by z = 7. Steep rises in the mass-growth curve correspond to major mergers, which deposit stellar mass abruptly, while plateaus indicate phases of in situ star formation and gradual gas accretion. These episodes are also associated with sharp bursts in the SFR (see the SFH in the upper-right panel of Fig. 1). At z < 12, when our ROCKSTAR-based halo-finder is reliable, three major mergers occur at t = 429, 519, and 567 Myr, with the first playing a central role in the evolution discussed in the following sections.
The mass evolution of Amaryllis broadly aligns with that of spectroscopically confirmed galaxies at z > 10. By z ∼ 14, its stellar mass of log(M★/M⊙)∼8 matches the range reported for GS-z14-0 and JADES-GS-z14-1 (Carniani et al. 2024a). By z ∼ 10, it grows to log(M★/M⊙)∼9.4, consistent with other bright candidates such as CEERS2-588 (Harikane et al. 2024). Its merging companions at z > 10 have masses comparable to observed galaxies like GN-z11 and UNCOVER-37126 (Bunker et al. 2023; Wang et al. 2023). While direct comparisons are limited by uncertainties in spectral energy distribution-derived stellar masses (see, e.g., Helton et al. 2025), the overall agreement suggests that Amaryllis represents a plausible analog of the most massive galaxies currently known at these redshifts. It also stands out as one of the first simulated galaxies to reach such a high stellar mass at z > 10, a regime still challenging to access in cosmological simulations due to volume and resolution constraints (see Yang et al. 2025 for FIRE and Illustris-TNG simulations).
The subsequent growth of Amaryllis toward the end of the epoch of reionization is also particularly interesting. By z ∼ 7, it reaches log(M★/M⊙) = 10.26, placing it among the most massive star-forming galaxies known at these epochs. This mass is consistent with estimates for sources in the REBELS sample (Bouwens et al. 2022), such as REBELS-25 before JWST observations (Dayal et al. 2022). However, more recent JWST/NIRSpec data suggest that REBELS galaxies have lower stellar masses than previously inferred (Rowland et al. 2024). If the most distant galaxy observed to date, GS-z14-0, follows a growth trajectory similar to that of Amaryllis, forming before z = 16 and accumulating ∼80% of its final stellar mass in less than 50 Myr, it could potentially evolve into an object comparable to, or even more massive than, REBELS-25, entering the rare population of the most massive galaxies known at z ∼ 7.
The bottom panel of Fig. 1 shows face-on composite views of Amaryllis at four key stages, built from stellar surface density (Σ★), gas surface density (Σgas), and the Habing field intensity (G). In terms of morphology, gas in Amaryllis shows a disk-like structure with emerging spiral features (102 ≲ n/cm3 ≲ 103) already at z > 11, while stars remain centrally concentrated. The radiation field is clumpy, with intense peaks (G > 103G0, where G0 = 1.6 × 10⁻³ erg cm−2 s−1 is the Milky Way value) tracing recent star formation. As the system undergoes repeated mergers, particularly the first major one t = 429 Myr, it enters a more disturbed dynamical phase. By z ∼ 7, it settles into a well-defined rotating disk with spiral arms, marking the reestablishment of rotational support. In Sect. 5 we examine how these interactions shape the morpho-kinematic evolution and ISM structure in more detail.
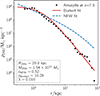 |
Fig. 2. DM halo structure of Amaryllis at z = 7.3. We show a spherically averaged DM density profile (black points) fitted with a Burkert (solid red) and an NFW (dashed blue) profile. |
3.2. Dark matter halo properties
To place Amaryllis in the broader context of ΛCDM, we studied the properties of its host DM halo at z = 7.3, i.e., close to the redshift of REBELS–25 (the most distant galaxy with a measured rotation curve; Rowland et al. 2024). At this epoch, the halo encloses a mass of M200c ≃ 1.5 × 10¹¹ M⊙ within a radius of R200c ≃ 20 kpc, as derived from the particle-based enclosed-density profile (Fig. 2). The corresponding virial velocity is  . Such values place Amaryllis in the high-mass tail of the expected halo distribution (e.g., Behroozi et al. 2013). The angular-momentum content of the halo was quantified by the dimensionless spin parameter in the Bullock et al. (2001) form,
 (1)
(1)
where J is the total angular momentum of DM particles within R200c. For Amaryllis we measure λ ≃ 0.016, a value on the low-to-typical side of the expected lognormal distribution (⟨λ⟩≃0.03, σlnλ ≃ 0.5; Macciò et al. 2007; Dutton & Macciò 2014), consistent with a system that has experienced recent mergers but is not an outlier in ΛCDM. The internal density structure is best reproduced by a cored Burkert profile (Burkert 1995),
![Mathematical equation: $$ \begin{aligned} \rho _{\rm Bur}(r) = \frac{\rho _0}{(1+r/r_{\rm c})\,[1+(r/r_{\rm c})^2]}, \end{aligned} $$](/articles/aa/full_html/2025/12/aa55499-25/aa55499-25-eq3.gif) (2)
(2)
with a core radius rc ≃ 1.9 kpc, corresponding to a formal concentration cBur ≡ R200c/rc ≃ 10.3, which we use here only as a proxy for halo compactness, not as a direct analog of NFW concentration. By contrast, an NFW fit (Navarro et al. 1997) produces systematically higher densities in the central few kiloparsecs, leaving significant residuals relative to the simulation. Such deviations from cuspy profiles are a well-known outcome of bursty stellar feedback, which drives central potential fluctuations that flatten the cusp into a core (e.g., Pontzen & Governato 2012; Lazar et al. 2020).
These properties indicate that Amaryllis resides in a massive yet not unusual ΛCDM halo. The combination of modest spin and relatively high concentration creates a potential that is deep enough to confine baryons but dynamically responsive to feedback and mergers. This environment naturally explains the baryon-dominated, rotation-supported gaseous disk predicted in massive (M★ > 1010 M⊙) epoch of reionization galaxies (Kohandel et al. 2024) and described for Amaryllis in Sect. 5.
Properties of Amaryllis compared with those of GS-z14-0 and GHZ2.
3.3. Emission line properties
To place Amaryllis in the context of recent ALMA detections of z > 10 galaxies (Carniani et al. 2025; Schouws et al. 2025b; Zavala et al. 2024), we followed the evolution of its [O III] 88 μm luminosity from z = 16 to z = 7. Our main predictions rely on CLOUDY-based radiative transfer models (Pallottini et al. 2022), applicable at z ≲ 12 where the ISM is sufficiently resolved. At earlier times, we adopted a simplified, physically motivated model that assigns [O III] emission based on local gas properties (density, temperature, and metallicity) and the global SFR (see Appendix A). This approximation is required because at this redshift the stellar mass is only M★ ∼ 107 M⊙, so a mass resolution of ∼104 M⊙ combined with highly flickering star formation (Pallottini & Ferrara 2023) leads to a noisy spatial distribution of young stars. In addition, at high gas densities and with a spatial resolution of ≃10 pc, ionization fronts are not numerically resolved (Pallottini et al. 2019; Decataldo et al. 2019). The combination of these limitations hampers the ability to make accurate spatially resolved predictions for emission lines from highly ionized species, such as [OIII], which originate from O++ and require a high ionization potential. Nevertheless, this approximation captures the expected scaling relations in unresolved star-forming regions and yields L[OIII] ∼ 108 L⊙ at z ∼ 14.
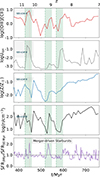 |
Fig. 3. Temporal evolution of various Amaryllis properties: LOIII/LCII (top panel), the ionization parameter Uion (second panel), gas metallicity, Z (third panel), gas number density, n (fourth panel), and star-formation variability, SFR3 Myr/SFR50 Myr (bottom panel). The correlations between LOIII/LCII and each other property are presented in Table 2. The vertical dashed green lines correspond to major merger events, and the dotted red line indicates the snapshot with the highest [OIII]/[CII]. |
Correlations of [OIII]/[CII] in Amaryllis.
For a robust comparison with observed galaxies, we selected a representative snapshot at z ∼ 11.3, where the ISM is well resolved and line emission predictions are reliable. This stage is shown in the bottom panel of Fig. 1. Table 1 summarizes the physical and emission-line properties of Amaryllis at this epoch, alongside those of two spectroscopically confirmed galaxies with ALMA+JWST coverage, GS-z14-0 and GHZ2. Included quantities span bulk properties, UV/optical lines (C III] λ1908, [O III] λ5007, [O II] λ3727, Hα, Hβ), FIR lines ([C II] 158 μm, [O I] 63 μm, [O III] 88 μm), and continuum emission.
Amaryllis shares many characteristics with observed super-early systems. Its gas fraction (fg ∼ 32%), average number density (n ∼ 136 cm−3), and metallicity (Z ∼ 0.03 Z⊙) are consistent with values inferred for both GS-z14-0 and GHZ2 (Carniani et al. 2024a). The SFR at this stage is ∼18 M⊙ yr−1, closely matching GS-z14-0. Its FIR line luminosities are also comparable: [O III] 88 μm falls within the range observed in both targets, while [C II] 158 μm remains consistent with the upper limit for GS-z14-0 from recent ALMA non-detections (Schouws et al. 2025a).
There are, however, relevant differences in the UV and FIR continuum properties. Amaryllis has a fainter UV magnitude (MUV ≈ −18.98) and a more compact UV half-light radius (63 pc), compared to GS-z14-0 (260 pc) but comparable to GHZ2 (50 pc). Its compact morphology, combined with high attenuation (AV ∼ 3.3), suggests that Amaryllis, like other SERRA galaxies (Pallottini et al. 2022), is caught in an obscured phase of star formation. Part of these differences could be due to the limited modeling of pre-supernova feedback and radiation pressure invoked by the attenuation-free model (Ferrara et al. 2023; Ferrara 2024) to clear the dust and to drive mini-quenching episodes (Gelli et al. 2023, 2025), as well as the lack of turbulence-informed post-processing for continuum emission (Di Mascia et al. 2025). Moreover, assumptions such as a fixed dust-to-metal ratio and a Milky Way-like extinction curve may not fully capture the diversity of dust properties and ISM conditions in high-redshift galaxies (Markov et al. 2023, 2025; Fisher et al. 2025). Addressing these limitations is beyond the scope of this paper, but it emphasizes the need for refined dust modeling in future work.
4. Drivers of the [OIII]/[CII] line ratio
As ALMA continues to detect multiple FIR lines in z > 10 galaxies, it becomes possible to apply ISM diagnostics developed at lower redshifts to the earliest cosmic epochs. Among these, the [OIII] 88 μm/[CII] 158 μm luminosity ratio ([OIII]/[CII]) stands out as a powerful probe of the ionization state and structure of the ISM. At z ∼ 6, this ratio is observed to span a broad range (1−20), significantly higher than in local starbursts or dwarfs (Harikane et al. 2020; Carniani et al. 2020). In the case of GS-z14-0, ALMA non-detection of [CII] yields a 3σ upper limit of L[CII] < 6 × 10⁷ L⊙, implying [OIII]/[CII] > 3.5 (Schouws et al. 2025a). Photoionization modeling suggests this galaxy has a relatively low gas density (n ∼ 50 cm−3), high gas phase metallicity (∼0.16 L⊙) and extreme ionization conditions (log Uion > −2). However, the origin of such elevated ratios-whether due to extreme metallicity, ISM conditions, or dynamical state-remains debated (Arata et al. 2020; Pallottini et al. 2022).
To investigate this further, we studied the evolution of [OIII]/[CII] in Amaryllis. As shown in the top panel of Fig. 3, this ratio varies substantially over time, peaking at [OIII]/[CII] ∼8 at z ∼ 10.4, about 20 Myr after its first major merger. This high value corresponds to a phase of intense, merger-driven star formation. At this moment, the ISM is relatively metal-poor (Z ∼ 0.02 Z⊙), strongly ionized (Uion ∼ 0.1), and relatively low density (n ∼ 49 cm−3). Our density and ionization parameter are in line with the results of idealized photo-ionization models for GS-z14-0 in Schouws et al. (2025a), although our gas-phase metallicity estimate is an order of magnitude lower.
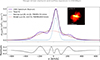 |
Fig. 4. Integrated kinematic diagnostics of Amaryllis during its post-merger starburst phase at z ∼ 10.4. Main panel: Integrated [O III] 88 μm spectrum from a face-on orientation, highlighting a prominent narrow component tracing star-forming gas near systemic velocity, and a broad, blueshifted wing indicative of ionized outflows. The overlaid two-Gaussian fit separates these components, with residuals shown in the bottom subplot. The inferred outflow velocity is |
Following this peak, the line ratio declines sharply (from 8 to 1 in within 40 Myr) in correspondence with a Uion drop. This could suggest that strong outflows produced by starbursts disperse the central gas reservoir, reducing the ionization parameter and temporarily suppressing [OIII] emission. Subsequent gas inflows associated with later mergers replenish the ISM, reigniting star formation and restarting the cycle. Indeed, the peak in Amaryllis at z ∼ 10.4 – shortly after its first major merger – is accompanied by broad [O III] line wings (see Sect. 5.1), hinting at powerful outflows.
To better understand the drivers of these variations, we correlated [OIII]/[CII] with the ionization parameter (Uion), gas-phase metallicity (Z), gas density (n), and star formation variability defined as SFR3 Myr/SFR50 Myr (Gelli et al. 2025; Endsley et al. 2025). As shown in the bottom panels of Fig. 3, [OIII]/[CII] tracks both Uion and SFR variability, peaking during recent bursts and in highly ionized phases. The Spearman coefficients listed in Table 2 confirm that [OIII]/[CII] is most strongly correlated with Uion (rs = 0.68), moderately with SFR variability (rs = 0.39), and weakly with n (rs = 0.16) and Z (rs = 0.26).
These findings suggest that elevated [OIII]/[CII] ratios at cosmic dawn primarily arise from bursty star formation episodes triggered by galaxy mergers. Such an interpretation naturally explains the observed properties of GS-z14-0, which is luminous in [OIII] yet undetected in [CII]. If GS-z14-0 is indeed observed during a similar merger-induced burst phase, our models suggest that its gas-phase metallicity could be substantially lower (Z ∼ 0.02 Z⊙) than previously inferred from simplified photoionization modeling, and it may host ionized gas outflows. Nevertheless, a critical ambiguity remains: although merger-driven starbursts clearly enhance ionization, thereby elevating [OIII]/[CII], disentangling feedback-driven outflows from kinematic disturbances directly associated with ongoing mergers remains challenging. To address these complexities, we explored in detail the kinematic signatures of Amaryllis during this crucial post-merger phase.
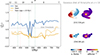 |
Fig. 5. Left panel: Evolution of mean circularity parameter, ⟨ϵcirc⟩=⟨Jz/Jcirc⟩, with cosmic time (t) and corresponding redshift (z) for Amaryllis. The horizontal dashed line indicates the disk threshold ( |

5. Galaxy kinematics at cosmic dawn
5.1. Outflows are interconnected with mergers
To directly probe the kinematic impact of bursty star formation, we examined the [O III] 88 μm line profile of Amaryllis during its peak post-merger phase at z ∼ 10.4. As discussed in the previous section, this epoch coincides with a sharp rise in the [OIII]/[CII] ratio driven by highly ionized conditions following a major merger. Figure 4 presents the integrated [OIII] spectrum from a face-on orientation, along with corresponding maps of the mean velocity and velocity dispersion. The [OIII] line profile is characterized by a prominent narrow core and broad, asymmetric wings extending to ±400 km s−1. Such spectral features are traditionally interpreted as signatures of galactic-scale outflows, and the face-on viewing geometry adopted here minimizes contributions from rotational motions, thus enhancing the clarity of the outflow signature.
To quantitatively assess these kinematics, we fit the integrated [OIII] spectrum with two Gaussian components: a narrow core (FWHM ≃ 74 km s−1), tracing star-forming gas at systemic velocity, and a broad, blueshifted component (FWHM ≃ 410 km s−1) indicative of high-velocity ionized gas outflows. From these Gaussian fits, we estimated the outflow velocity using the widely adopted relation (Rupke et al. 2005)
 (3)
(3)
which yielded voutflow ≃ 258 km s−1. This ionized gas outflow velocity is higher than those observed in local galaxies with comparable stellar masses (Marasco et al. 2023), yet somewhat lower than the range found for low-mass star-forming galaxies at 3 < z < 9 (Carniani et al. 2024b).
However, we caution that the two-component Gaussian model leaves residual emission at |v|≳200 km s−1, suggesting the presence of additional, unresolved kinematic structures. These residuals may reflect complex outflow geometries, inflows, or merger-driven disturbances not fully captured by the model. Indeed, additional insight from our simulations reveals that the interpretation of the broad [OIII] wings is not straightforward. While the kinematic and morphological signatures are consistent with ionized outflows, a deeper analysis indicates that both inflowing and outflowing gas contribute significantly to the broad [OIII] wings, suggesting a complex, multiphase velocity field rather than a purely outflow. At z = 10.4, outflows and inflows have comparable specific kinetic energies (∼6 − 8 × 10¹³ erg g−1). Given these limitations, we refrain from over-interpreting our results based on this simplified empirical approach. A detailed discussion of the energetics, metal loading, and multiphase velocity structure will be presented in a forthcoming paper.
At z = 10.4, Amaryllis is still in the final stages of merger coalescence, with two distinct stellar and metallicity peaks separated by less than 100 pc, despite its DM halo appearing dynamically relaxed. Such interactions naturally induce strong turbulent motions and may significantly contribute to the broad wings observed in the integrated [OIII] profile.
Crucially, the edge-on projection of [OIII] emission shown in Fig. 4 reveals a clear extra-planar, ionized gas, further supporting the interpretation of outflows. In contrast, the cold gas traced by the [CII] line at the same epoch does not show comparable features, reinforcing the conclusion that the broad [OIII] emission primarily traces ionized outflows rather than rotation-supported components. Nevertheless, this case highlights the fundamental complexity intrinsic to high-redshift galaxy kinematics, where distinguishing purely feedback-driven outflows from dynamical merger signatures is particularly challenging.
In Amaryllis at z = 10.4, we carefully minimized rotational contamination by aligning the galaxy face-on based on the full three-dimensional stellar velocity information. While such precise control is achievable in simulations, it is rarely attainable in observations. Thus, to robustly quantify outflows and distinguish them from merger-driven turbulence or rotation-induced velocity broadening at early cosmic epochs, we need alternative observational strategies and diagnostics. This consideration is especially critical if rotationally supported gaseous disks form earlier than previously thought, as suggested by recent observations and simulations at high z (e.g., Rowland et al. 2024; Kohandel et al. 2024). Therefore, in the next section we investigate when such disks might form in massive, early galaxies, and how their early emergence complicates interpretations of observed kinematic signatures.
5.2. Early gas disk formation
Recent high-resolution ALMA and JWST observations indicate that rotationally supported galaxy disks may have formed surprisingly early, even at cosmic dawn (Rizzo et al. 2020; Roman-Oliveira et al. 2023; Rowland et al. 2024; Ferreira et al. 2022; Kartaltepe et al. 2023; Kohandel et al. 2024). To test this scenario, we quantified disk formation in Amaryllis using the circularity parameter (ϵcirc ≡ Jz/Jcirc; Simons et al. 2019) defined as the ratio between the gas or stellar angular momentum aligned with the galaxy’s rotation axis (Jz) and the angular momentum of a circular orbit at the same radius (Jcirc)3, and used in simulated galaxies (e.g., Ceverino et al. 2015; Zana et al. 2022; Rizzo et al. 2022). To implement this method, we identified the galactic center following Zana et al. (2022), locating the minimum stellar gravitational potential via the tree algorithm of Barnes & Hut (1986), as implemented by Grudić & Gurvich (2021). We then iteratively determined the galaxy’s radial extent (Reff) and its vertical height, which isolates a coherent, rotating structure by progressively excluding inflowing or outflowing gas outside the vertical scale height. Once Jz and Jcirc were computed for each resolution element, we derived the mass-weighted average circularity for the cold gas (T ≤ 1.5 × 10³ K), all stellar particles, and the subset of stars younger than 20 Myr.
Following Simons et al. (2019), components with  (
( ) were considered to be rotation-supported (dispersion-dominated). In Fig. 5, by tracing the circularity of gas and stars, we see that the cold gas in Amaryllis remains largely rotation-supported (
 ) throughout its evolution. However, we should be careful not to over-interpret these results, especially during the merger phase, as the algorithm might not be adequate for such complex dynamical structures.
Interestingly, the stellar component remains dispersion-dominated for most of the evolution: only by z ∼ 7 do newly formed stars inherit the ordered motions of the gas disk, raising their circularity above the rotation-dominated threshold. Thus, cold gas settles into a disk structure nearly 300 Myr before stars do. This offset reflects gas dissipation after mergers, while collisionless stars retain past dynamical memory. This is consistent with the halo properties (see Sect. 3.2). The modest spin ensures that baryons are not spread too diffusely, while the feedback-flattened inner profile lowers central shear and facilitates the regrowth of a cold gaseous disk after each merger. The resulting system is baryon-dominated in its inner few kiloparsecs, where gas rotation defines the dynamical state even though stars lag behind in angular-momentum buildup.
To connect with observations, the right panels of Fig. 5 feature mock kinematic maps of Amaryllis at z ≃ 11 and i = 60° in a non-merger phase at z > 10. Both [C II] and [O III] show a clear velocity gradient and centrally peaked dispersion, with σ[OIII] ≈ 17 km s−1 and σ[CII] ≈ 11 km s−1, yielding V/σ ∼ 4 − 6 depending on the emission line used. These values place Amaryllis firmly in the “cold disk” regime. In comparison, tentative ALMA measurements for GS-z14-0 report σ[OIII] < 40 km s−1 and V/σ > 2.5 (Scholtz et al. 2025), consistent with our predictions. Deeper, higher-resolution ALMA observations of [O III] 88 μm could thus reveal one of the most distant dynamically cold disks to date and help disentangle disk rotation from merger-driven turbulence and outflows at z > 10.
In short, Amaryllis demonstrates that dynamically cold gaseous disks can emerge in ordinary ΛCDM halos as early as z > 11. Their early survival is enabled by baryon dissipation and a feedback-responsive halo potential, while stellar disks lag behind until fresh stars form in situ within the gas disk. This coexistence of ordered gas rotation and dispersion-dominated stars may be a defining feature of massive early galaxies.
6. Summary and conclusion
The discovery of bright, compact galaxies at z > 10, made possible by JWST and ALMA, is fundamentally reshaping our understanding of galaxy formation at cosmic dawn. Among these sources are systems like GS-z14-0 and GHZ2, which stand out for their intense [OIII] 88 μm emission yet weak or undetected [CII] 158 μm lines-puzzling signatures that challenge existing theoretical models. In this work we used the high-resolution SERRA zoom-in simulations to investigate the physical origin of such extreme FIR properties and the dynamical states of early galaxies.
Our focus was Amaryllis, a synthetic analog of these [OIII]-luminous, [CII]-faint systems. Tracked from z = 16 to z = 7, Amaryllis grows from a low-mass progenitor to a M★ ∼ 2 × 10¹⁰ M⊙ galaxy through a sequence of hierarchical mergers and starburst episodes. By z ∼ 11.3, it exhibits a stellar mass, SFR, compact size, and FIR/UV line luminosities that match those of GS-z14-0, making it a compelling theoretical counterpart.
We find that extreme [OIII]/[CII] ratios, reaching values as high as ∼8, are not steady-state features but rather arise during brief, highly dynamic phases. These episodes are triggered by major mergers, which drive rapid gas inflows, compress the ISM, and ignite intense, bursty star formation. As a result, the ISM becomes strongly ionized (Uion ∼ 0.1) and metal-poor (Z ∼ 0.02 − 0.03 Z⊙), creating ideal conditions for [OIII] to dominate the FIR line emission. During these bursts, we also find evidence of powerful outflows, with voutflow ∼ 260 km s−1, as revealed by the broad, asymmetric wings in the integrated [OIII] spectrum and the bipolar morphology of [OIII] emission in edge-on view. The [OIII]/[CII] ratio correlates most strongly with ionization-parameter and star-formation variability, reinforcing its interpretation as a tracer of nonequilibrium conditions induced by dynamical transformations.
Yet, perhaps most surprisingly, we find that even during such a chaotic assembly, Amaryllis forms a dynamically cold gaseous disk as early as z ∼ 11, with a V/σ of ∼4 and 6 in [OIII] and [CII], respectively. This rotationally supported gas structure persists even as the stellar component remains dispersion-dominated well into lower redshifts. This coexistence of ordered rotation with merger-driven bursts and outflows suggests a richer picture of early galaxy dynamics than often assumed.
Finally, by quantifying the DM halo of Amaryllis at z = 7.3, we show that it resides in a massive yet not unusual ΛCDM halo, with M200c ≃ 1.5 × 10¹¹ M⊙ and λ ≃ 0.016. The inner density profile is best described by a Burkert core with rc ≃ 2 kpc, corresponding to a formal concentration cBurkert ≃ 10.3. We caution that this value is not directly comparable to the standard NFW c − M relations; it reflects the cusp-flattening impact of baryonic feedback rather than a departure from ΛCDM. Thus, the key result is that Amaryllis lies on the high-mass tail of the expected halo distribution but is not an outlier. The combination of modest spin, early assembly, and a feedback-flattened inner profile provides a dynamically responsive potential that enables cold gas to settle into a disk long before the stellar component. This halo context reinforces the interpretation of Amaryllis as a baryon-dominated, rotation-supported system at cosmic dawn.
These findings imply that some of the brightest FIR-emitting galaxies observed at z > 10 have been caught in a brief, rapidly evolving phase, when mergers and feedback violently reshape the ISM and rotation begins to emerge and stabilize the gaseous component. The complexity of these systems cautions against overly simplified interpretations based on global line ratios alone and highlights the need for spatially resolved ALMA follow-up to reveal the true dynamical and morphological states of early galaxies.
In this context, Amaryllis serves as both a theoretical analog and a predictive framework, bridging the gap between compact, metal-poor galaxies observed in the FIR and the dynamically mature systems expected by the end of reionization. As future surveys push deeper into the early Universe, combining kinematic tracers, resolved line diagnostics, and multiline modeling will be essential to disentangle the interplay between mergers, outflows, and disk formation in the first galaxies.
By “digital twin”, we mean a simulation that not only reproduces the global properties of a real system, but also mimics its internal structure, dynamics, and evolution in a physically motivated way. The term highlights the close physical analogy between the simulated galaxy and its observed counterparts.
The burstiness parameter,  (Ferrara et al. 2019), for these galaxies spans the range κs ∼ 2 − 150 (Pallottini et al. 2022), indicative of a bursty star formation mode.
For each particle, Jz is the component of the specific angular momentum aligned with the galaxy’s net angular momentum;  is the specific angular momentum of a notional circular orbit at radius r, assuming spherical symmetry for the enclosed mass M(< r) (baryonic + DM), with G being the gravitational constant.
Acknowledgments
AF acknowledges support from the ERC Advanced Grant INTERSTELLAR H2020/740120. Partial support from the Carl Friedrich von Siemens-Forschungspreis der Alexander von Humboldt-Stiftung Research Award is kindly acknowledged (AF). This research was supported (AF) in part by grant NSF PHY-2309135 to the Kavli Institute for Theoretical Physics (KITP). We acknowledge the CINECA award under the ISCRA initiative for the availability of high-performance computing resources and support from the Class B project SERRA HP10BPUZ8F (PI: Pallottini). We gratefully acknowledge the computational resources of the Center for High-Performance Computing (CHPC) at SNS. We acknowledge use of the Python programming language (Van Rossum & de Boer 1991), Astropy (Astropy Collaboration 2013), Cython (Behnel et al. 2011), Matplotlib (Hunter 2007), numba (Lam et al. 2015), NumPy (van der Walt et al. 2011), PYNBODY (Pontzen et al. 2013), and SciPy (Virtanen et al. 2020).
References
- Arata, S., Yajima, H., Nagamine, K., Abe, M., & Khochfar, S. 2020, MNRAS, 498, 5541 [NASA ADS] [CrossRef] [Google Scholar]
- Arrabal Haro, P., Dickinson, M., Finkelstein, S. L., et al. 2023, ApJ, 951, L22 [NASA ADS] [CrossRef] [Google Scholar]
- Astropy Collaboration (Robitaille, T. P., et al.) 2013, A&A, 558, A33 [NASA ADS] [CrossRef] [EDP Sciences] [Google Scholar]
- Atek, H., Shuntov, M., Furtak, L. J., et al. 2023, MNRAS, 519, 1201 [Google Scholar]
- Baes, M., & Camps, P. 2015, Astron. Comput., 12, 33 [NASA ADS] [CrossRef] [Google Scholar]
- Bakx, T. J. L. C., Zavala, J. A., Mitsuhashi, I., et al. 2023, MNRAS, 519, 5076 [NASA ADS] [CrossRef] [Google Scholar]
- Barnes, J., & Hut, P. 1986, Nature, 324, 446 [NASA ADS] [CrossRef] [Google Scholar]
- Behnel, S., Bradshaw, R., Citro, C., et al. 2011, Comput. Sci. Eng., 13, 31 [Google Scholar]
- Behrens, C., Pallottini, A., Ferrara, A., Gallerani, S., & Vallini, L. 2018, MNRAS, 477, 552 [NASA ADS] [CrossRef] [Google Scholar]
- Behroozi, P. S., Wechsler, R. H., & Wu, H.-Y. 2013, ApJ, 762, 109 [NASA ADS] [CrossRef] [Google Scholar]
- Bouwens, R. J., Smit, R., Schouws, S., et al. 2022, ApJ, 931, 160 [NASA ADS] [CrossRef] [Google Scholar]
- Bullock, J. S., Dekel, A., Kolatt, T. S., et al. 2001, ApJ, 555, 240 [NASA ADS] [CrossRef] [Google Scholar]
- Bunker, A. J., Saxena, A., Cameron, A. J., et al. 2023, A&A, 677, A88 [NASA ADS] [CrossRef] [EDP Sciences] [Google Scholar]
- Burkert, A. 1995, ApJ, 447, L25 [NASA ADS] [Google Scholar]
- Calabrò, A., Castellano, M., Zavala, J. A., et al. 2024, ApJ, 975, 245 [CrossRef] [Google Scholar]
- Camps, P., & Baes, M. 2015, Astron. Comput., 9, 20 [Google Scholar]
- Carniani, S., Ferrara, A., Maiolino, R., et al. 2020, MNRAS, 499, 5136 [NASA ADS] [CrossRef] [Google Scholar]
- Carniani, S., Hainline, K., D’Eugenio, F., et al. 2024a, Nature, 633, 318 [CrossRef] [Google Scholar]
- Carniani, S., Venturi, G., Parlanti, E., et al. 2024b, A&A, 685, A99 [NASA ADS] [CrossRef] [EDP Sciences] [Google Scholar]
- Carniani, S., D’Eugenio, F., Ji, X., et al. 2025, A&A, 696, A87 [NASA ADS] [CrossRef] [EDP Sciences] [Google Scholar]
- Castellano, M., Fontana, A., Treu, T., et al. 2022, ApJ, 938, L15 [NASA ADS] [CrossRef] [Google Scholar]
- Castellano, M., Napolitano, L., Fontana, A., et al. 2024, ApJ, 972, 143 [Google Scholar]
- Ceverino, D., Dekel, A., Tweed, D., & Primack, J. 2015, MNRAS, 447, 3291 [NASA ADS] [CrossRef] [Google Scholar]
- Curtis-Lake, E., Carniani, S., Cameron, A., et al. 2023, Nat. Astron., 7, 622 [NASA ADS] [CrossRef] [Google Scholar]
- Dayal, P., Ferrara, A., Sommovigo, L., et al. 2022, MNRAS, 512, 989 [NASA ADS] [CrossRef] [Google Scholar]
- De Looze, I., Cormier, D., Lebouteiller, V., et al. 2014, A&A, 568, A62 [NASA ADS] [CrossRef] [EDP Sciences] [Google Scholar]
- Decataldo, D., Pallottini, A., Ferrara, A., Vallini, L., & Gallerani, S. 2019, MNRAS, 487, 3377 [Google Scholar]
- Di Mascia, F., Pallottini, A., Sommovigo, L., & Decataldo, D. 2025, A&A, 695, A77 [NASA ADS] [CrossRef] [EDP Sciences] [Google Scholar]
- Donnan, C. T., McLeod, D. J., Dunlop, J. S., et al. 2022, ArXiv e-prints [arXiv:2207.12356] [Google Scholar]
- Dutton, A. A., & Macciò, A. V. 2014, MNRAS, 441, 3359 [Google Scholar]
- Endsley, R., Chisholm, J., Stark, D. P., Topping, M. W., & Whitler, L. 2025, ApJ, 987, 189 [Google Scholar]
- Ferland, G. J., Chatzikos, M., Guzmán, F., et al. 2017, Rev. Mex. Astron. Astrofis., 53, 385 [NASA ADS] [Google Scholar]
- Ferrara, A. 2024, A&A, 684, A207 [NASA ADS] [CrossRef] [EDP Sciences] [Google Scholar]
- Ferrara, A., Vallini, L., Pallottini, A., et al. 2019, MNRAS, 489, 1 [Google Scholar]
- Ferrara, A., Pallottini, A., & Dayal, P. 2023, MNRAS, 522, 3986 [NASA ADS] [CrossRef] [Google Scholar]
- Ferrara, A., Carniani, S., di Mascia, F., et al. 2025, A&A, 694, A215 [NASA ADS] [CrossRef] [EDP Sciences] [Google Scholar]
- Ferreira, L., Adams, N., Conselice, C. J., et al. 2022, ApJ, 938, L2 [NASA ADS] [CrossRef] [Google Scholar]
- Finkelstein, S. L., Leung, G. C. K., Bagley, M. B., et al. 2024, ApJ, 969, L2 [NASA ADS] [CrossRef] [Google Scholar]
- Fisher, R., Bowler, R. A. A., Stefanon, M., et al. 2025, MNRAS, 539, 109 [Google Scholar]
- Fujimoto, S., Finkelstein, S. L., Burgarella, D., et al. 2023, ApJ, 955, 130 [NASA ADS] [CrossRef] [Google Scholar]
- Furlanetto, S. R., & Mirocha, J. 2023, MNRAS, 523, 5274 [NASA ADS] [CrossRef] [Google Scholar]
- Gelli, V., Salvadori, S., Pallottini, A., & Ferrara, A. 2020, MNRAS, 498, 4134 [NASA ADS] [CrossRef] [Google Scholar]
- Gelli, V., Salvadori, S., Ferrara, A., Pallottini, A., & Carniani, S. 2021, ApJ, 913, L25 [NASA ADS] [CrossRef] [Google Scholar]
- Gelli, V., Salvadori, S., Ferrara, A., Pallottini, A., & Carniani, S. 2023, ApJ, 954, L11 [NASA ADS] [CrossRef] [Google Scholar]
- Gelli, V., Pallottini, A., Salvadori, S., et al. 2025, ApJ, 985, 126 [Google Scholar]
- Grassi, T., Bovino, S., Schleicher, D. R. G., et al. 2014, MNRAS, 439, 2386 [Google Scholar]
- Grudić, M., & Gurvich, A. 2021, J. Open Source Softw., 6, 3675 [CrossRef] [Google Scholar]
- Harikane, Y., Ouchi, M., Inoue, A. K., et al. 2020, ApJ, 896, 93 [Google Scholar]
- Harikane, Y., Ouchi, M., Oguri, M., et al. 2023, ApJS, 265, 5 [NASA ADS] [CrossRef] [Google Scholar]
- Harikane, Y., Nakajima, K., Ouchi, M., et al. 2024, ApJ, 960, 56 [NASA ADS] [CrossRef] [Google Scholar]
- Harikane, Y., Inoue, A. K., Ellis, R. S., et al. 2025, ApJ, 980, 138 [NASA ADS] [Google Scholar]
- Heintz, K. E., Pollock, C. L., Witstok, J., et al. 2025, ApJ, 987, L2 [Google Scholar]
- Helton, J. M., Rieke, G. H., Alberts, S., et al. 2025, Nat. Astron., 9, 729 [Google Scholar]
- Hsiao, T. Y.-Y., Abdurro’uf, Coe, D., et al. 2024, ApJ, 973, 8 [NASA ADS] [CrossRef] [Google Scholar]
- Hunter, J. D. 2007, Comput. Sci. Eng., 9, 90 [NASA ADS] [CrossRef] [Google Scholar]
- Kaasinen, M., van Marrewijk, J., Popping, G., et al. 2023, A&A, 671, A29 [NASA ADS] [CrossRef] [EDP Sciences] [Google Scholar]
- Kartaltepe, J. S., Rose, C., Vanderhoof, B. N., et al. 2023, ApJ, 946, L15 [NASA ADS] [CrossRef] [Google Scholar]
- Knebe, A., Libeskind, N. I., Pearce, F., et al. 2013, MNRAS, 428, 2039 [NASA ADS] [CrossRef] [Google Scholar]
- Kohandel, M., Pallottini, A., Ferrara, A., et al. 2019, MNRAS, 487, 3007 [NASA ADS] [CrossRef] [Google Scholar]
- Kohandel, M., Pallottini, A., Ferrara, A., et al. 2020, MNRAS, 499, 1250 [Google Scholar]
- Kohandel, M., Ferrara, A., Pallottini, A., et al. 2023, MNRAS, 520, L16 [Google Scholar]
- Kohandel, M., Pallottini, A., Ferrara, A., et al. 2024, A&A, 685, A72 [NASA ADS] [CrossRef] [EDP Sciences] [Google Scholar]
- Lam, S. K., Pitrou, A., & Seibert, S. 2015, Proc. Second Workshop on the LLVM Compiler Infrastructure in HPC, 1 [Google Scholar]
- Lazar, A., Bullock, J. S., Boylan-Kolchin, M., et al. 2020, MNRAS, 497, 2393 [NASA ADS] [CrossRef] [Google Scholar]
- Macciò, A. V., Dutton, A. A., van den Bosch, F. C., et al. 2007, MNRAS, 378, 55 [Google Scholar]
- Marasco, A., Belfiore, F., Cresci, G., et al. 2023, A&A, 670, A92 [NASA ADS] [CrossRef] [EDP Sciences] [Google Scholar]
- Markov, V., Gallerani, S., Pallottini, A., et al. 2023, A&A, 679, A12 [NASA ADS] [CrossRef] [EDP Sciences] [Google Scholar]
- Markov, V., Gallerani, S., Ferrara, A., et al. 2025, Nat. Astron., 9, 458 [Google Scholar]
- Matteri, A., Ferrara, A., & Pallottini, A. 2025, A&A, 701, A186 [NASA ADS] [CrossRef] [EDP Sciences] [Google Scholar]
- Naidu, R. P., Oesch, P. A., van Dokkum, P., et al. 2022, ApJ, 940, L14 [NASA ADS] [CrossRef] [Google Scholar]
- Nakazato, Y., Yoshida, N., & Ceverino, D. 2023, ApJ, 953, 140 [NASA ADS] [CrossRef] [Google Scholar]
- Navarro, J. F., Frenk, C. S., & White, S. D. M. 1997, ApJ, 490, 493 [Google Scholar]
- Ono, Y., Harikane, Y., Ouchi, M., et al. 2023, ApJ, 951, 72 [NASA ADS] [CrossRef] [Google Scholar]
- Pallottini, A., & Ferrara, A. 2023, A&A, 677, L4 [NASA ADS] [CrossRef] [EDP Sciences] [Google Scholar]
- Pallottini, A., Ferrara, A., Bovino, S., et al. 2017a, MNRAS, 471, 4128 [NASA ADS] [CrossRef] [Google Scholar]
- Pallottini, A., Ferrara, A., Gallerani, S., et al. 2017b, MNRAS, 465, 2540 [CrossRef] [Google Scholar]
- Pallottini, A., Ferrara, A., Decataldo, D., et al. 2019, MNRAS, 487, 1689 [Google Scholar]
- Pallottini, A., Ferrara, A., Gallerani, S., et al. 2022, MNRAS, 513, 5621 [NASA ADS] [Google Scholar]
- Pallottini, A., Ferrara, A., Gallerani, S., et al. 2025, A&A, 699, A6 [NASA ADS] [CrossRef] [EDP Sciences] [Google Scholar]
- Pérez-González, P. G., Östlin, G., Costantin, L., et al. 2025, ArXiv e-prints [arXiv:2503.15594] [Google Scholar]
- Pontzen, A., & Governato, F. 2012, MNRAS, 421, 3464 [NASA ADS] [CrossRef] [Google Scholar]
- Pontzen, A., Roškar, R., Stinson, G., & Woods, R. 2013, Astrophysics Source Code Library [record ascl:1305.002] [Google Scholar]
- Popping, G. 2023, A&A, 669, L8 [NASA ADS] [CrossRef] [EDP Sciences] [Google Scholar]
- Rizzo, F., Vegetti, S., Powell, D., et al. 2020, Nature, 584, 201 [Google Scholar]
- Rizzo, F., Kohandel, M., Pallottini, A., et al. 2022, A&A, 667, A5 [NASA ADS] [CrossRef] [EDP Sciences] [Google Scholar]
- Robertson, B. E., Tacchella, S., Johnson, B. D., et al. 2023, Nat. Astron., 7, 611 [NASA ADS] [CrossRef] [Google Scholar]
- Robertson, B., Johnson, B. D., Tacchella, S., et al. 2024, ApJ, 970, 31 [NASA ADS] [CrossRef] [Google Scholar]
- Roman-Oliveira, F., Fraternali, F., & Rizzo, F. 2023, MNRAS, 521, 1045 [NASA ADS] [CrossRef] [Google Scholar]
- Rosdahl, J., & Teyssier, R. 2015, MNRAS, 449, 4380 [Google Scholar]
- Rowland, L. E., Hodge, J., Bouwens, R., et al. 2024, MNRAS, 535, 2068 [Google Scholar]
- Rupke, D. S., Veilleux, S., & Sanders, D. B. 2005, ApJS, 160, 115 [Google Scholar]
- Santini, P., Fontana, A., Castellano, M., et al. 2023, ApJ, 942, L27 [NASA ADS] [CrossRef] [Google Scholar]
- Scholtz, J., Parlanti, E., Carniani, S., et al. 2025, ArXiv e-prints [arXiv:2503.10751] [Google Scholar]
- Schouws, S., Bouwens, R. J., Algera, H., et al. 2025a, ArXiv e-prints [arXiv:2502.01610] [Google Scholar]
- Schouws, S., Bouwens, R. J., Ormerod, K., et al. 2025b, ApJ, 988, 19 [Google Scholar]
- Simons, R. C., Kassin, S. A., Snyder, G. F., et al. 2019, ApJ, 874, 59 [Google Scholar]
- Stark, D. P., Topping, M. W., Endsley, R., & Tang, M. 2025, ArXiv e-prints [arXiv:2501.17078] [Google Scholar]
- Tacchella, S., Eisenstein, D. J., Hainline, K., et al. 2023, ApJ, 952, 74 [NASA ADS] [CrossRef] [Google Scholar]
- Teyssier, R. 2002, A&A, 385, 337 [CrossRef] [EDP Sciences] [Google Scholar]
- Treu, T., Roberts-Borsani, G., Bradac, M., et al. 2022, ApJ, 935, 110 [NASA ADS] [CrossRef] [Google Scholar]
- Vallini, L., Ferrara, A., Pallottini, A., & Gallerani, S. 2017, MNRAS, 467, 1300 [NASA ADS] [Google Scholar]
- Vallini, L., Pallottini, A., Ferrara, A., et al. 2018, MNRAS, 473, 271 [NASA ADS] [CrossRef] [Google Scholar]
- Vallini, L., Ferrara, A., Pallottini, A., Carniani, S., & Gallerani, S. 2020, MNRAS, 495, L22 [Google Scholar]
- van der Walt, S., Colbert, S. C., & Varoquaux, G. 2011, Comput. Sci. Eng., 13, 22 [Google Scholar]
- Van Rossum, G., & de Boer, J. 1991, CWI Quarterly, 4, 283 [Google Scholar]
- Virtanen, P., Gommers, R., Oliphant, T. E., et al. 2020, Nat. Meth., 17, 261 [Google Scholar]
- Wang, B., Fujimoto, S., Labbé, I., et al. 2023, ApJ, 957, L34 [NASA ADS] [CrossRef] [Google Scholar]
- Yang, S., Lidz, A., Li, H., et al. 2025, ArXiv e-prints [arXiv:2504.18006] [Google Scholar]
- Yoon, I., Carilli, C. L., Fujimoto, S., et al. 2023, ApJ, 950, 61 [NASA ADS] [CrossRef] [Google Scholar]
- Zana, T., Lupi, A., Bonetti, M., et al. 2022, MNRAS, 515, 1524 [NASA ADS] [CrossRef] [Google Scholar]
- Zanella, A., Pallottini, A., Ferrara, A., et al. 2021, MNRAS, 500, 118 [Google Scholar]
- Zavala, J. A., Bakx, T., Mitsuhashi, I., et al. 2024, ApJ, 977, L9 [NASA ADS] [Google Scholar]
- Zavala, J. A., Castellano, M., Akins, H. B., et al. 2025, Nat. Astron., 9, 155 [Google Scholar]
Appendix A: Sub-grid model for [O III] emission at z > 12
At redshifts z > 12, the ISM of galaxies in our simulations is not sufficiently resolved to apply radiative transfer models such as CLOUDY with confidence. To provide a physically motivated estimate of [O III] 88μm luminosity in this regime, we adopted a sub-grid model that links unresolved star-forming activity to local gas conditions on a per-cell basis. We assigned [OIII] luminosity to each gas cell according to the following prescription:
![Mathematical equation: $$ \begin{aligned} L_{\mathrm{[OIII]88}} = \epsilon _0(n, T, Z)\, \left(\frac{f_{\mathrm{O}}}{0.7}\right)\, \left(\frac{Z}{Z_0}\right)\, \mathrm{SFR}_{\mathrm{global}} \quad [L_\odot ], \end{aligned} $$](/articles/aa/full_html/2025/12/aa55499-25/aa55499-25-eq31.gif) (A.1)
(A.1)
where Z is the local gas metallicity, fO = 0.7 is the assumed oxygen mass fraction in metals, Z0 = 0.2 Z⊙ is a reference metallicity, SFRglobal is the total SFR within the field of view, averaged over the past 10 Myr, and ϵ0(n, T, Z) is a dynamic efficiency factor that depends on local ISM conditions. The efficiency parameter is defined as
 (A.2)
(A.2)
with ϵbase = 3 × 10⁴ L⊙ M⊙−1 yr, n0 = 10 cm−3, T0 = 104 K, and Z0 = 0.2 Z⊙, α = 0.5, β = −0.5, and γ = 1.0. The model is applied only to dense, cool gas (n > 100 cm−3 and T < 104 K), expected to dominate fine-structure line emission in unresolved ISM conditions. To avoid unphysical values from extreme fluctuations in gas properties, we capped the efficiency at ϵ0 ≤ 106 L⊙ M⊙−1 yr.
The resulting cell-by-cell luminosity is projected along the line of sight and normalized by volume to produce surface brightness maps in units of L⊙ kpc−2. While approximate, this model provides a physically motivated lower limit on [O III] emission in the unresolved ISM regime.
All Tables
All Figures
|
Fig. 1. Overview of “Amaryllis”, a digital twin of early galaxies. Upper-left panel: Merger history of Amaryllis. Each curve shows the stellar mass (M★) of the progenitors as a function of cosmic time (t), with the corresponding redshift (z) on the upper axis. The black line indicates the main galaxy, while each colored line represents a merging satellite. Solid lines mark the phases during which each system remains distinct, and dashed lines highlight the mergers. The observational measurements shown include massive z > 10 galaxies, spectroscopically confirmed by JWST (violet triangles; Ferrara et al. 2025, Table 1), z ∼ 6 − 9 galaxies from CEERS and COSMOS (green triangles; Harikane et al. 2024), and REBELS sources (red triangles; Dayal et al. 2022, Table 2). Upper-right panel: SFH of Amaryllis throughout cosmic time, with vertical lines corresponding to minor (dotted) and major (dashed) merger events. Bottom panels: Composite images at four evolutionary stages, built from the stellar surface density (Σ★), gas surface density (Σgas), and the Habing field intensity (G). |
| In the text | |
|
Fig. 2. DM halo structure of Amaryllis at z = 7.3. We show a spherically averaged DM density profile (black points) fitted with a Burkert (solid red) and an NFW (dashed blue) profile. |
| In the text | |
|
Fig. 3. Temporal evolution of various Amaryllis properties: LOIII/LCII (top panel), the ionization parameter Uion (second panel), gas metallicity, Z (third panel), gas number density, n (fourth panel), and star-formation variability, SFR3 Myr/SFR50 Myr (bottom panel). The correlations between LOIII/LCII and each other property are presented in Table 2. The vertical dashed green lines correspond to major merger events, and the dotted red line indicates the snapshot with the highest [OIII]/[CII]. |
| In the text | |
|
Fig. 4. Integrated kinematic diagnostics of Amaryllis during its post-merger starburst phase at z ∼ 10.4. Main panel: Integrated [O III] 88 μm spectrum from a face-on orientation, highlighting a prominent narrow component tracing star-forming gas near systemic velocity, and a broad, blueshifted wing indicative of ionized outflows. The overlaid two-Gaussian fit separates these components, with residuals shown in the bottom subplot. The inferred outflow velocity is |
| In the text | |
|
Fig. 5. Left panel: Evolution of mean circularity parameter, ⟨ϵcirc⟩=⟨Jz/Jcirc⟩, with cosmic time (t) and corresponding redshift (z) for Amaryllis. The horizontal dashed line indicates the disk threshold ( |
| In the text | |
Current usage metrics show cumulative count of Article Views (full-text article views including HTML views, PDF and ePub downloads, according to the available data) and Abstracts Views on Vision4Press platform.
Data correspond to usage on the plateform after 2015. The current usage metrics is available 48-96 hours after online publication and is updated daily on week days.
Initial download of the metrics may take a while.