Fig. 2.
Download original image
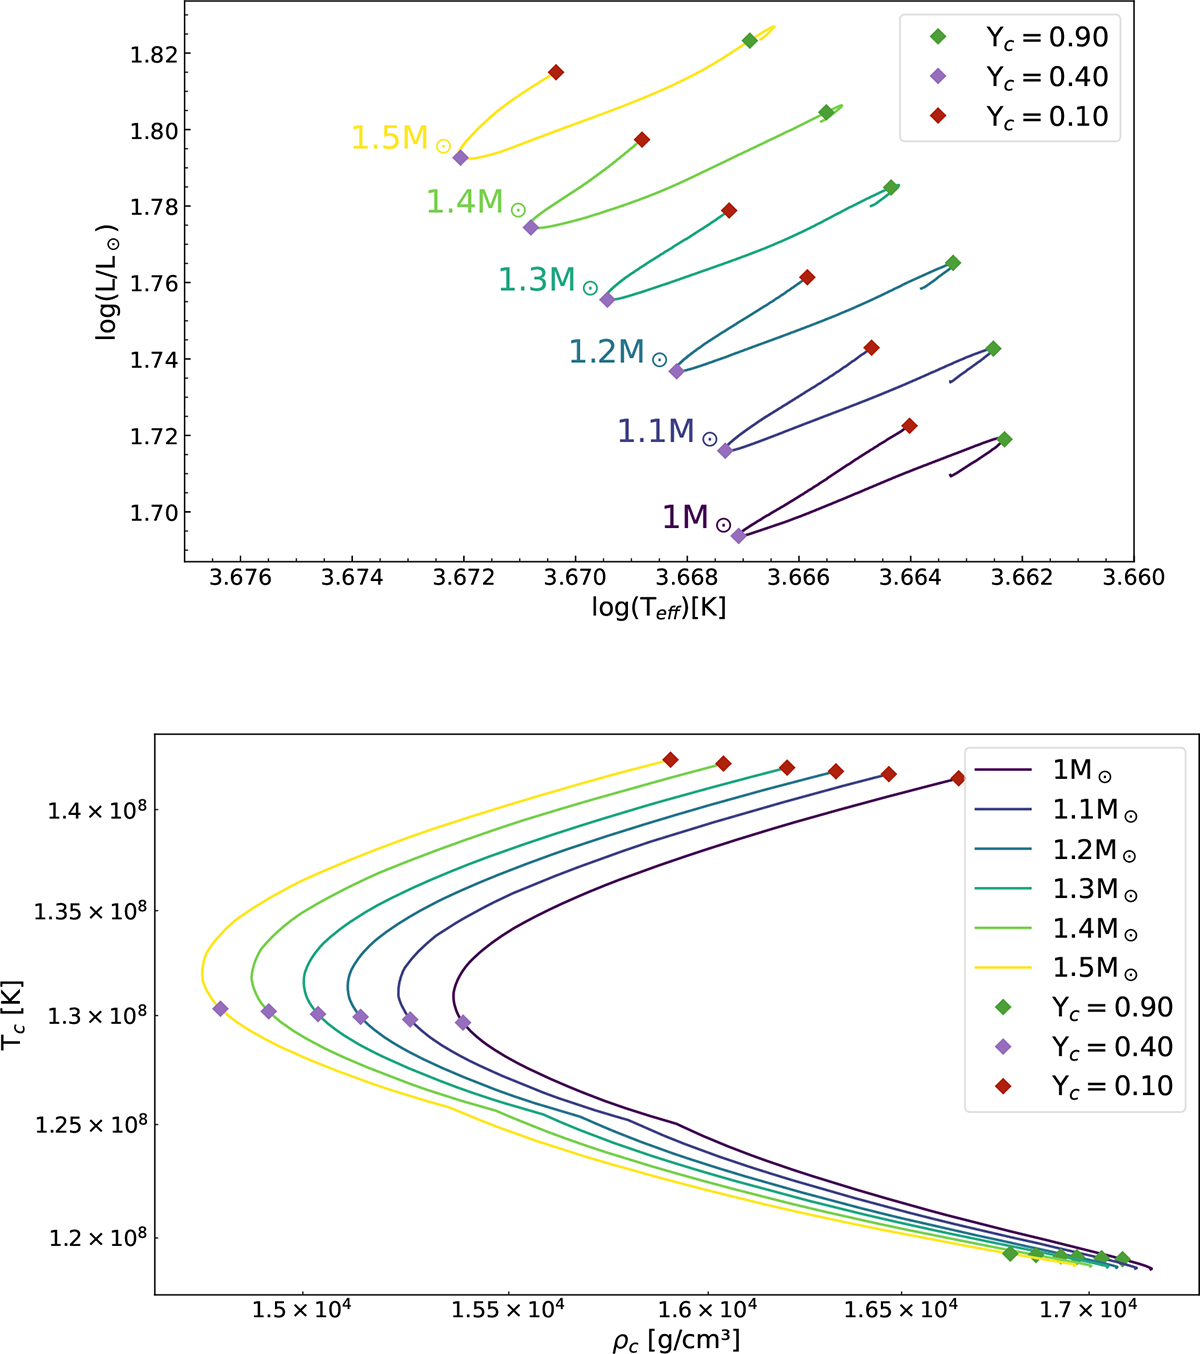
Top panel: Evolutionary track in the Hertzsprung–Russell diagram of the sequence of models from 1 M⊙ to 1.5 M⊙ stellar masses at fixed He-core mass. The markers indicate the state of central helium abundance studied: Yc = 0.90, Yc = 0.40, and Yc = 0.10. Bottom panel: Central temperature as a function of the central density in logarithmic scale for the corresponding set of masses.
Current usage metrics show cumulative count of Article Views (full-text article views including HTML views, PDF and ePub downloads, according to the available data) and Abstracts Views on Vision4Press platform.
Data correspond to usage on the plateform after 2015. The current usage metrics is available 48-96 hours after online publication and is updated daily on week days.
Initial download of the metrics may take a while.