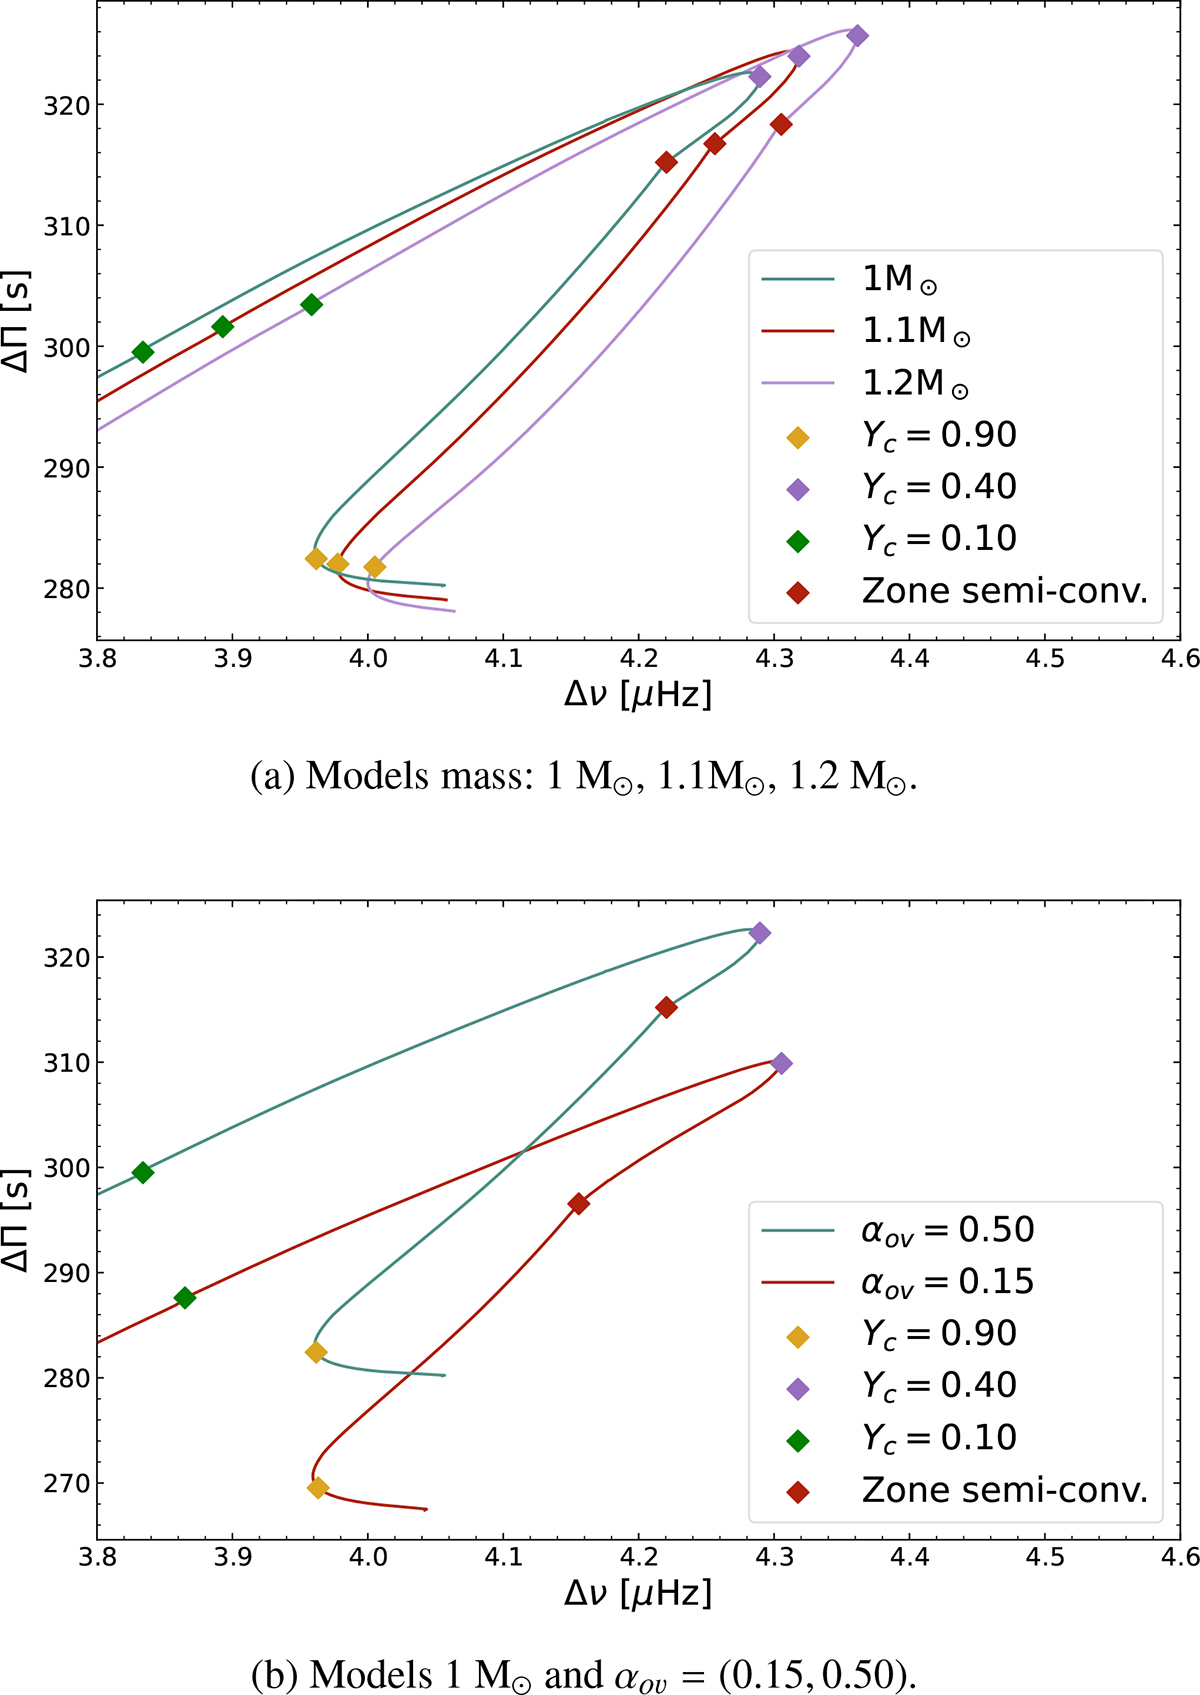
Fig. 3.
Download original image
Top panel: Diagram Δν − ΔΠ of three models of different stellar mass. Each point corresponds to a stage (Yc) in the evolution on the horizontal branch. The markers indicate the state of central helium abundance (Yc = 0.90, Yc = 0.40, and Yc = 0.10) and the appearance of the semi-convective layer. Bottom panel: Diagram Δν − ΔΠ of two models with different overshooting parameters αov.
Current usage metrics show cumulative count of Article Views (full-text article views including HTML views, PDF and ePub downloads, according to the available data) and Abstracts Views on Vision4Press platform.
Data correspond to usage on the plateform after 2015. The current usage metrics is available 48-96 hours after online publication and is updated daily on week days.
Initial download of the metrics may take a while.