Open Access
Fig. 7.
Download original image
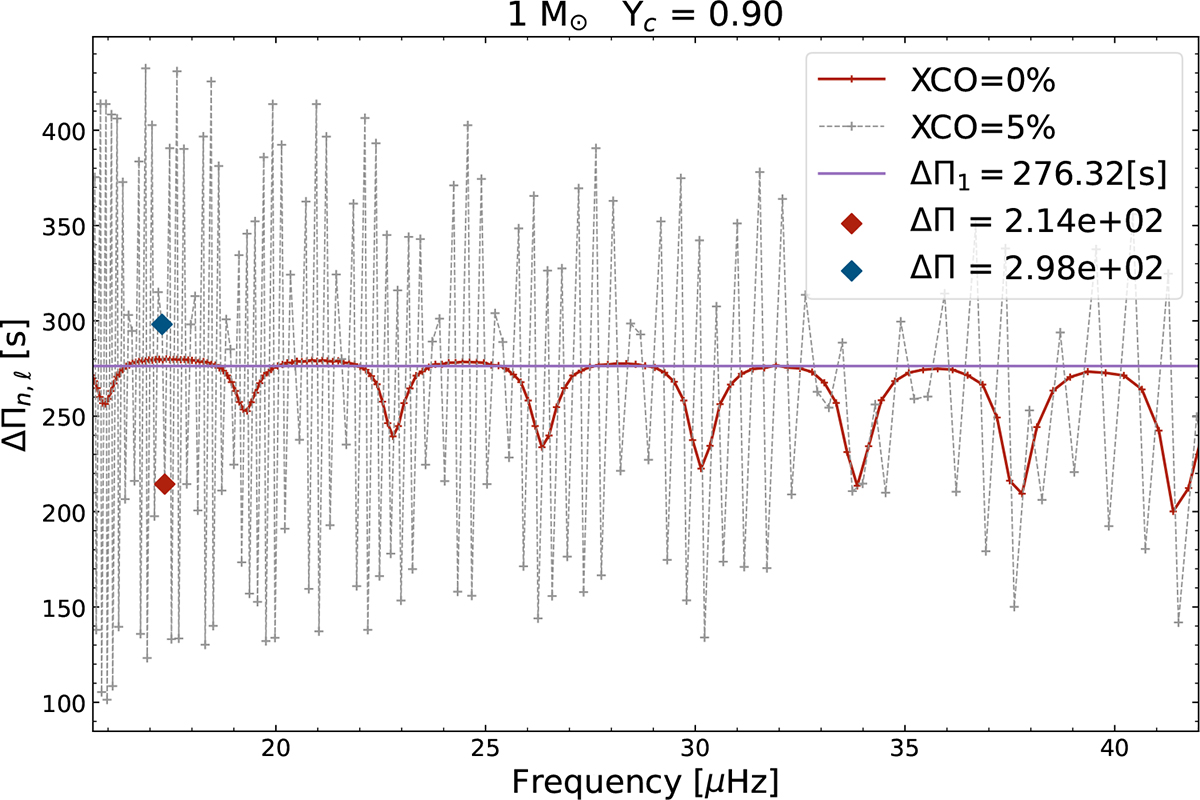
Period spacing of computed ℓ = 1 mode frequencies for 1 M⊙, Yc = 0.90 models with differing carbon production from the He-flash. This figure compares models with XCO = 5% (grey dots) and XCO = 0% (red dots) along with the asymptotic value for the XCO = 0% model (solid violet line).
Current usage metrics show cumulative count of Article Views (full-text article views including HTML views, PDF and ePub downloads, according to the available data) and Abstracts Views on Vision4Press platform.
Data correspond to usage on the plateform after 2015. The current usage metrics is available 48-96 hours after online publication and is updated daily on week days.
Initial download of the metrics may take a while.