Fig. 8.
Download original image
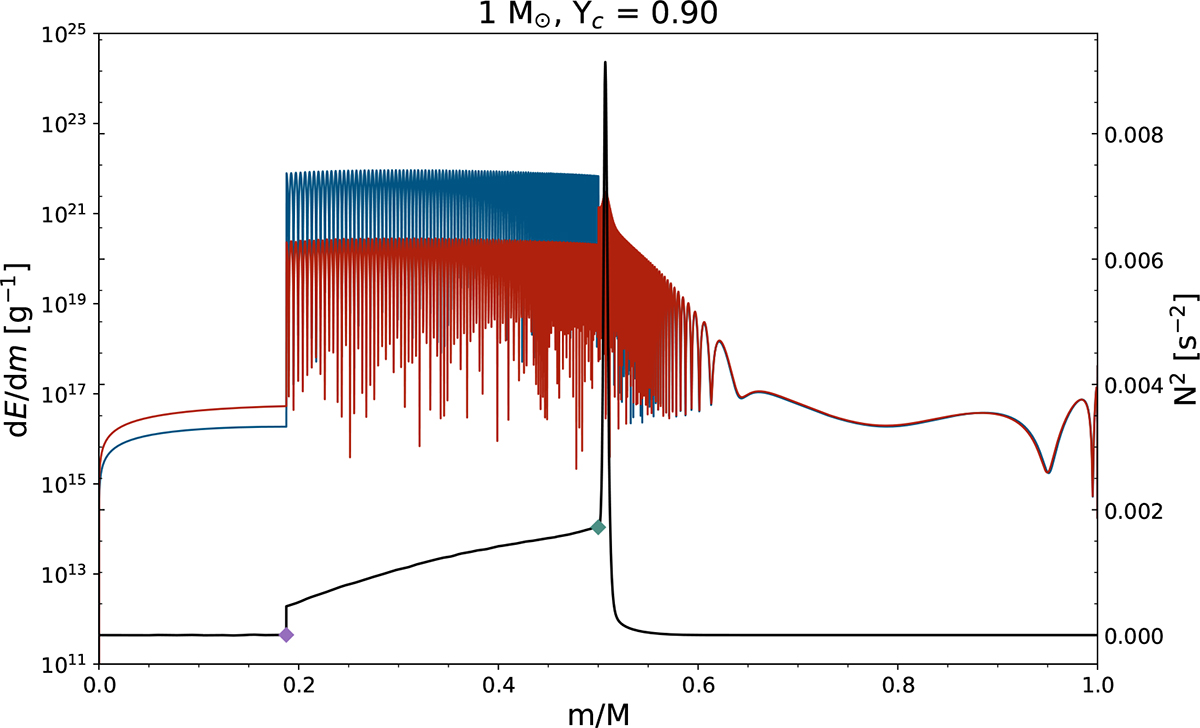
Logarithmic-scale integrand of the energy density for two successive modes of the 1 M⊙, Yc = 0.90 model including the He-flash discontinuity, compared to the Brunt-Väisälä frequency profile (black line). Purple and green markers respectively indicate the sharp transitions of the Brunt-Väisälä frequency profile at the core and the He-flash discontinuity.
Current usage metrics show cumulative count of Article Views (full-text article views including HTML views, PDF and ePub downloads, according to the available data) and Abstracts Views on Vision4Press platform.
Data correspond to usage on the plateform after 2015. The current usage metrics is available 48-96 hours after online publication and is updated daily on week days.
Initial download of the metrics may take a while.