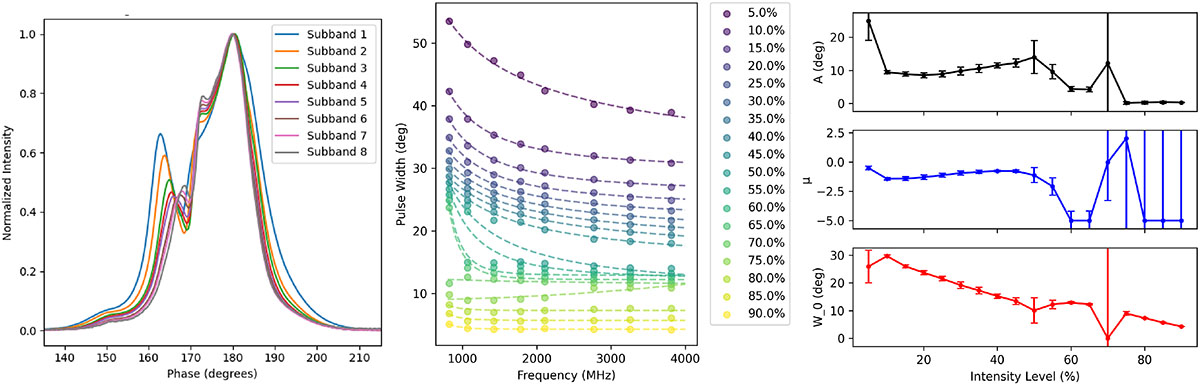
Fig. 1.
Download original image
Profile width evolution of PSR J0738–4042. The figure on the left shows the stack of normalized profiles, with the profile peak placed at 180° for each subband. (Middle) The profile width has been measured at varying intensity levels, shown from dark to light colors, in relation to frequency. The dashed lines represent the best-fit solutions of Eq. (1). The resulting parameters as a function of profile intensity level are shown in the right panel. The black, blue, and red lines respectively represent the amplitude, A; the power index, μ; and the y-offset, W0.
Current usage metrics show cumulative count of Article Views (full-text article views including HTML views, PDF and ePub downloads, according to the available data) and Abstracts Views on Vision4Press platform.
Data correspond to usage on the plateform after 2015. The current usage metrics is available 48-96 hours after online publication and is updated daily on week days.
Initial download of the metrics may take a while.