Fig. 10.
Download original image
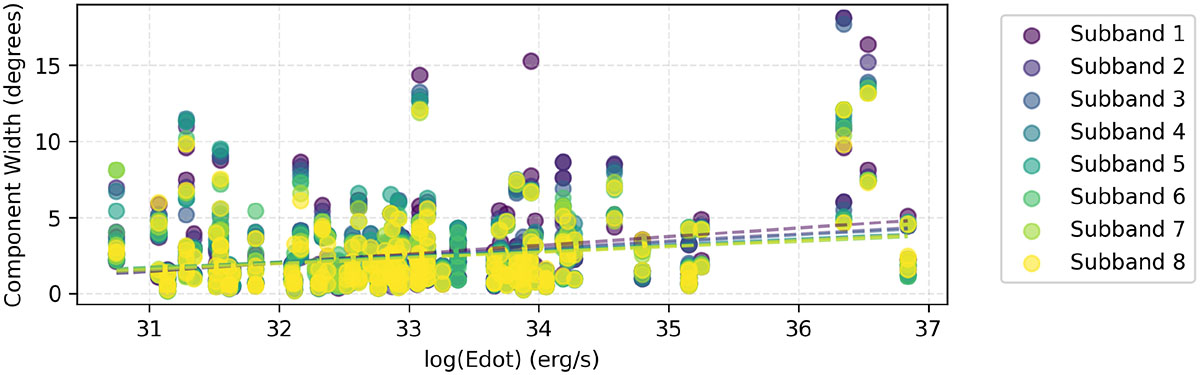
Relationship between the component width (deg) and ![]() (erg/s) across eight frequency subbands. Each subband is represented by a different color according to the viridis color map, with corresponding linear regression fits shown as dashed lines. The data reveal a positive correlation, suggesting that pulsars with a higher Ė tend to exhibit wider emission components. The scatter in component widths is more pronounced at higher Ė values, particularly above 1036 erg/s.
(erg/s) across eight frequency subbands. Each subband is represented by a different color according to the viridis color map, with corresponding linear regression fits shown as dashed lines. The data reveal a positive correlation, suggesting that pulsars with a higher Ė tend to exhibit wider emission components. The scatter in component widths is more pronounced at higher Ė values, particularly above 1036 erg/s.
Current usage metrics show cumulative count of Article Views (full-text article views including HTML views, PDF and ePub downloads, according to the available data) and Abstracts Views on Vision4Press platform.
Data correspond to usage on the plateform after 2015. The current usage metrics is available 48-96 hours after online publication and is updated daily on week days.
Initial download of the metrics may take a while.