Fig. 12.
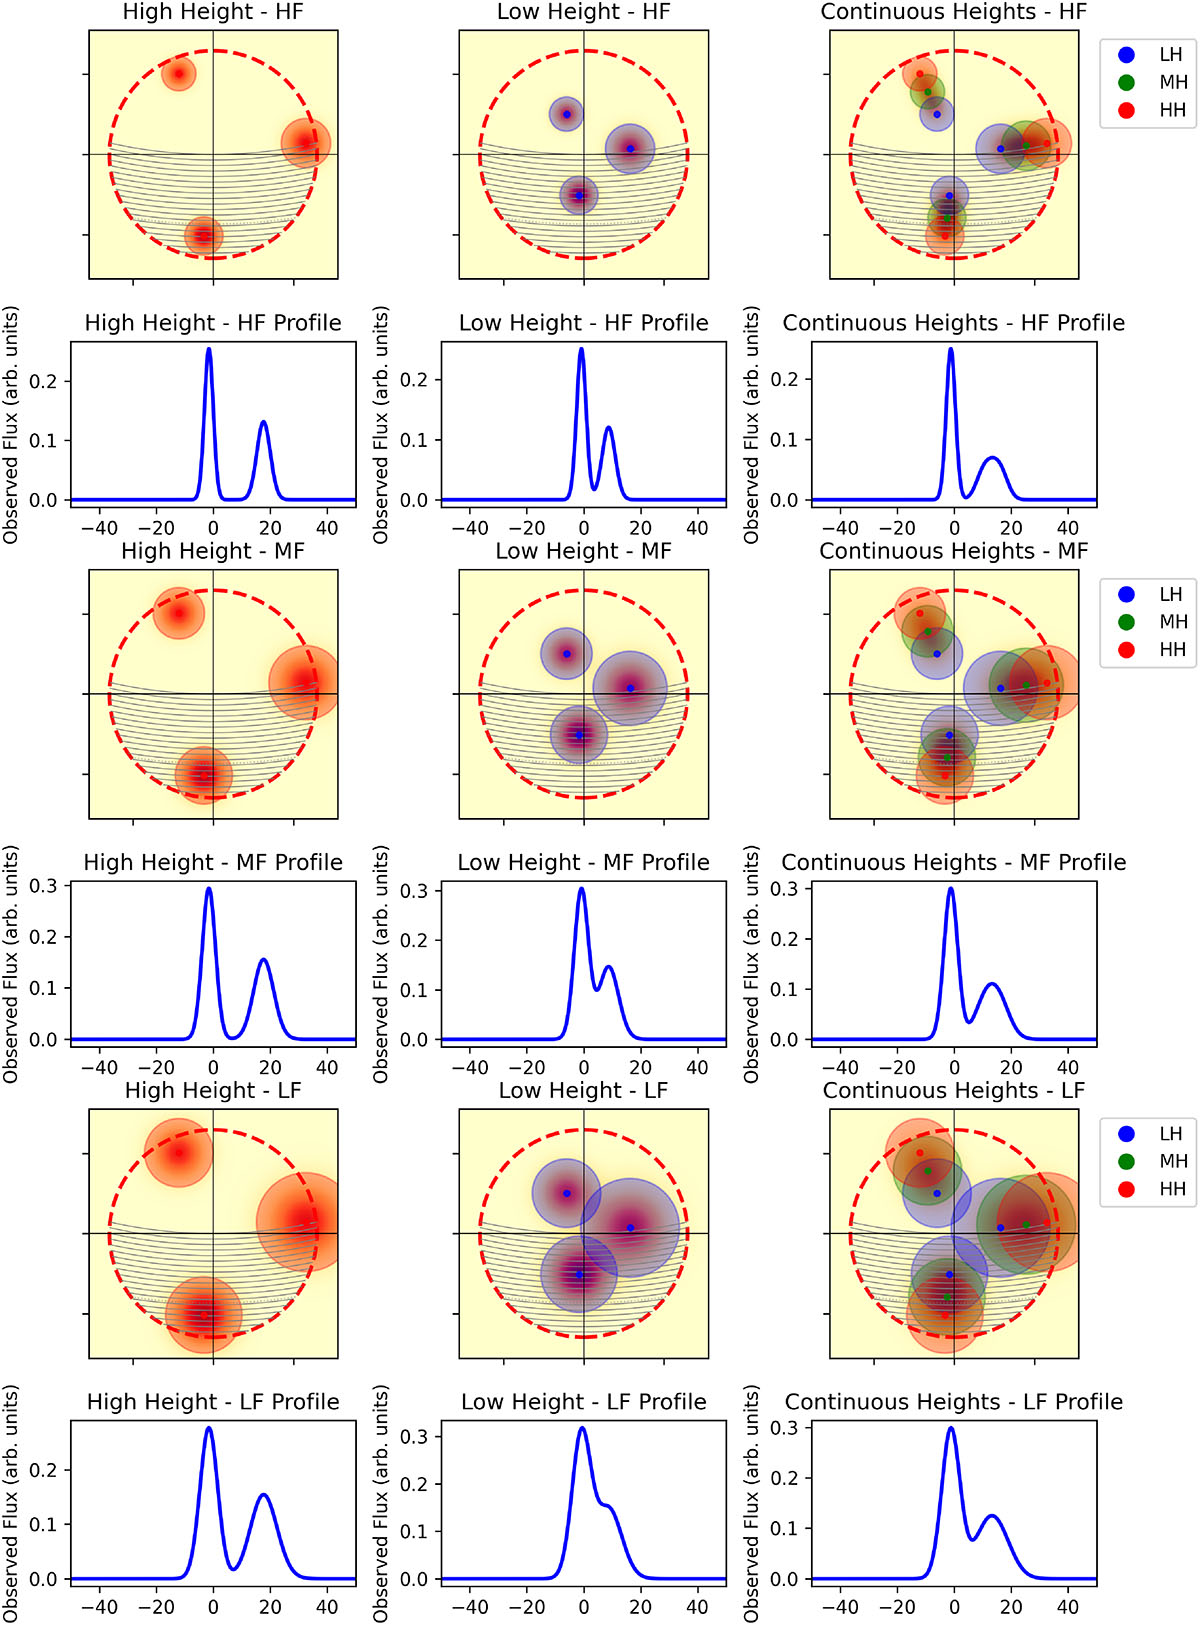
Download original image
Illustration of a fan beam model. Beam maps (top row in each frequency band) and profiles (bottom row in each frequency band) for three height configurations are presented in separate columns: high height (left), low height (center), and multiple heights (right). From top to bottom, each pair of rows corresponds to a different frequency band: high frequency (HF), medium frequency (MF), and low frequency (LF). The red dashed circle indicates the emission boundary, and the color scale denotes the relative flux intensity. The profile illustrates how amplitude varies with horizontal displacement. (See text for details.)
Current usage metrics show cumulative count of Article Views (full-text article views including HTML views, PDF and ePub downloads, according to the available data) and Abstracts Views on Vision4Press platform.
Data correspond to usage on the plateform after 2015. The current usage metrics is available 48-96 hours after online publication and is updated daily on week days.
Initial download of the metrics may take a while.