Open Access
Fig. 2.
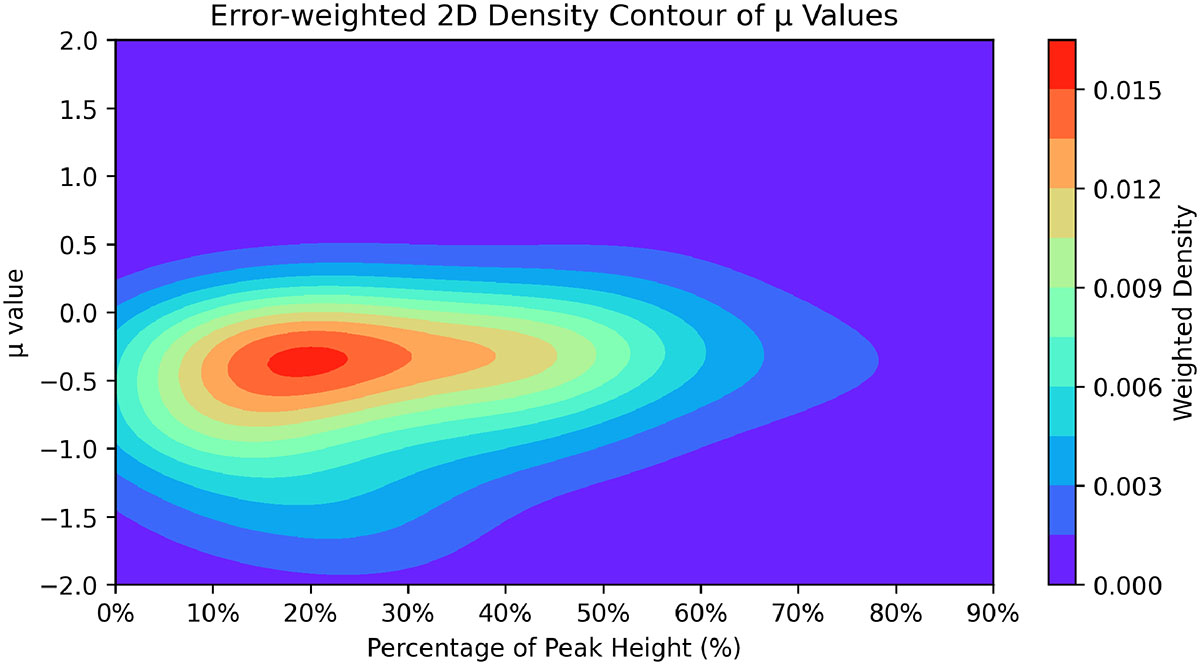
Download original image
Distribution of frequency evolution index (μ) of profile width measured at different profile intensity level (Wx) for 144 pulsars. The 2D contour map shows the counts weighted by the uncertainty of each data point.
Current usage metrics show cumulative count of Article Views (full-text article views including HTML views, PDF and ePub downloads, according to the available data) and Abstracts Views on Vision4Press platform.
Data correspond to usage on the plateform after 2015. The current usage metrics is available 48-96 hours after online publication and is updated daily on week days.
Initial download of the metrics may take a while.