Open Access
Fig. 6.
Download original image
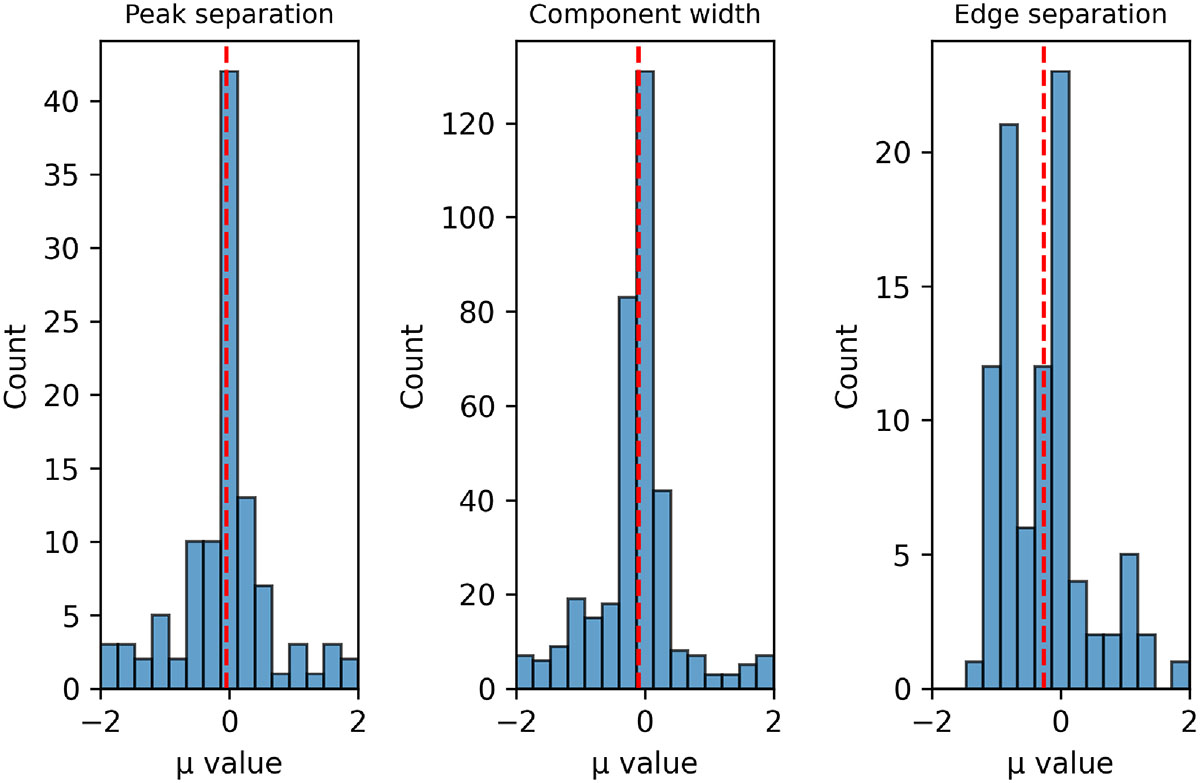
Histogram of μcomp.sep (left), μcomp.width (middle), and μcomp.edge derived from fitting the maximum peak component separation, the individual component widths, and the maximum edge component separation with Eq. (1). (See text for details.)
Current usage metrics show cumulative count of Article Views (full-text article views including HTML views, PDF and ePub downloads, according to the available data) and Abstracts Views on Vision4Press platform.
Data correspond to usage on the plateform after 2015. The current usage metrics is available 48-96 hours after online publication and is updated daily on week days.
Initial download of the metrics may take a while.