Fig. 8.
Download original image
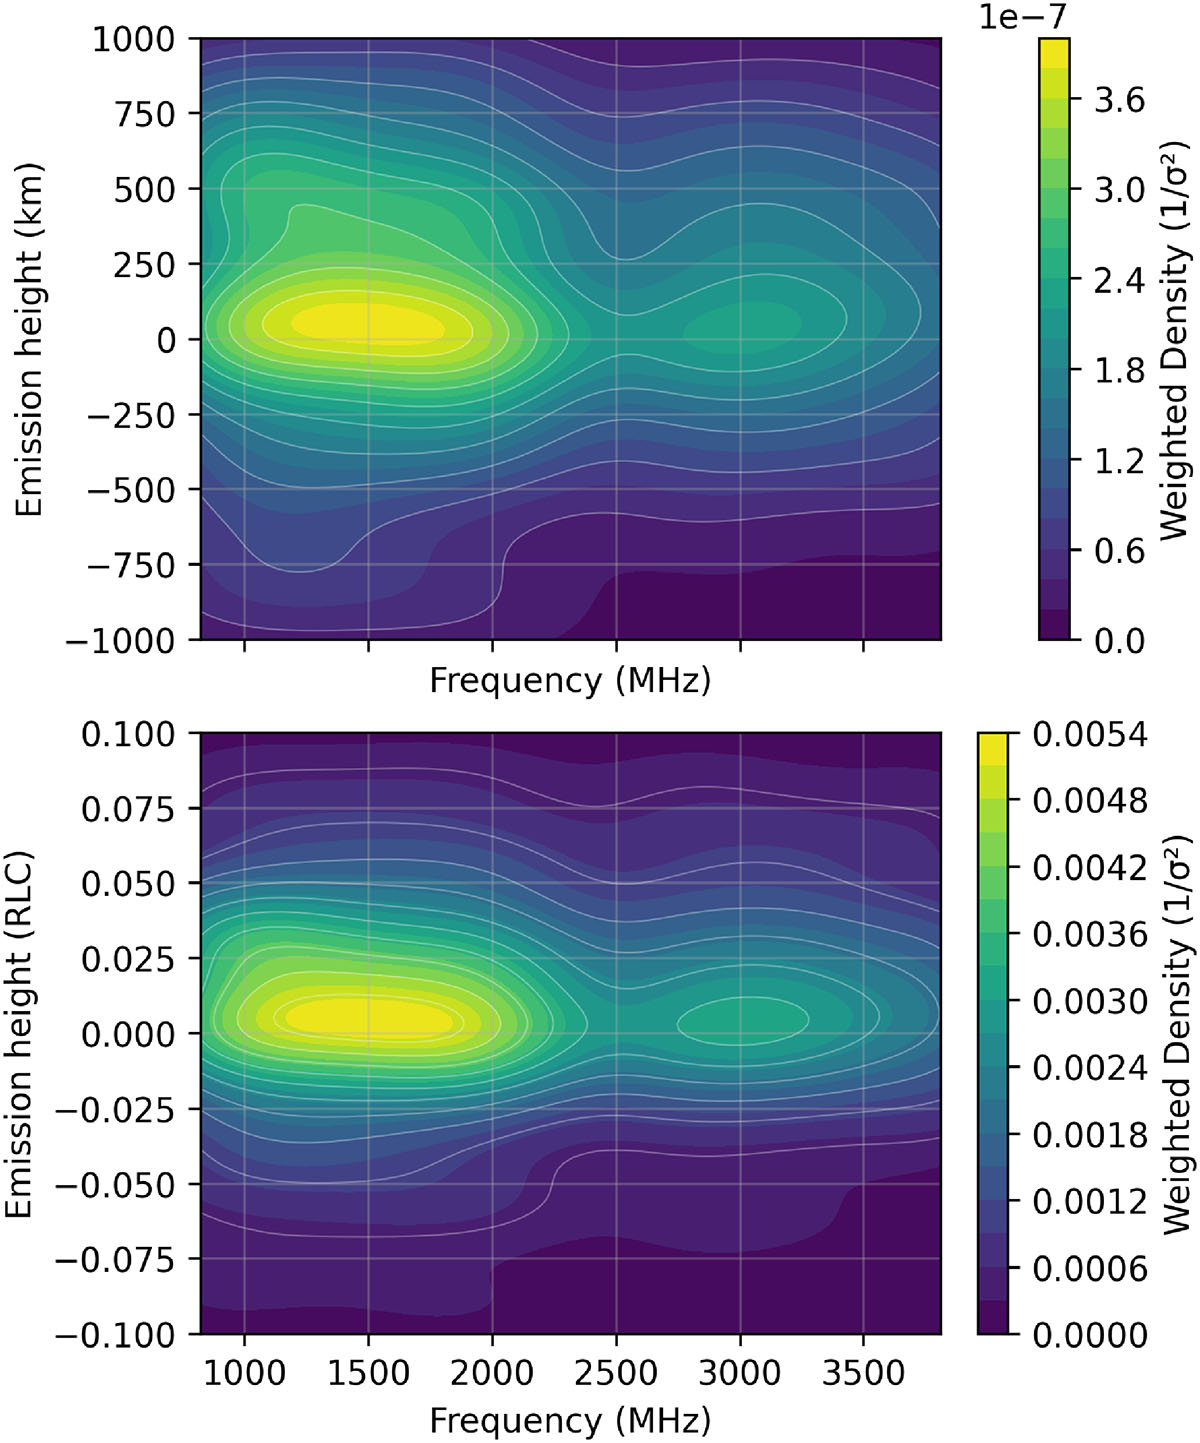
Emission height rbcw vs. ν (1000–3500 MHz) showing weighted density distributions. The panels display emission heights in kilometers (top) and light cylinder radii in RLC (bottom). The color gradient represents the probability density weighted by 1/σ2 of individual measurements, highlighting regions with a higher measurement confidence.
Current usage metrics show cumulative count of Article Views (full-text article views including HTML views, PDF and ePub downloads, according to the available data) and Abstracts Views on Vision4Press platform.
Data correspond to usage on the plateform after 2015. The current usage metrics is available 48-96 hours after online publication and is updated daily on week days.
Initial download of the metrics may take a while.