Fig. 9.
Download original image
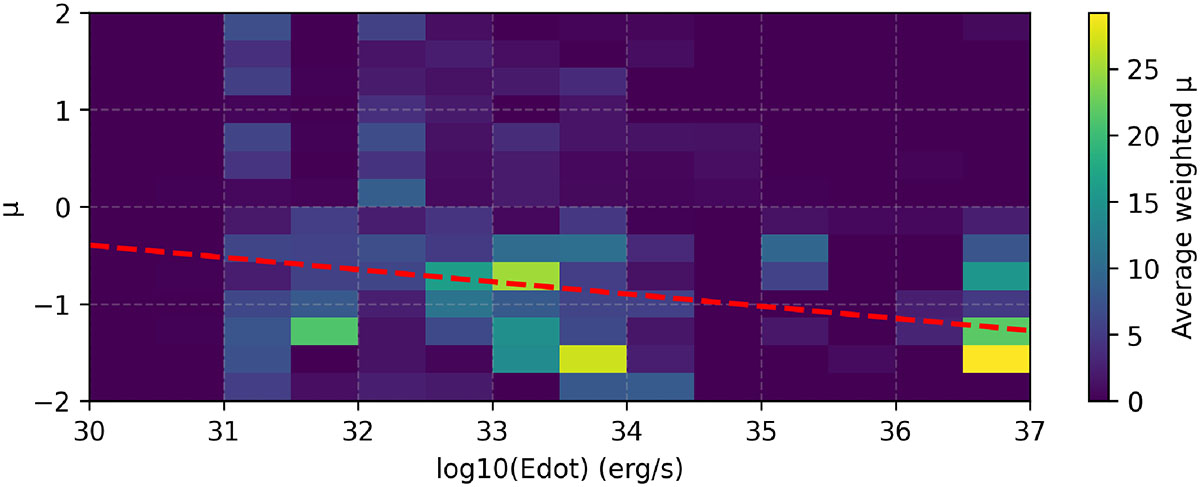
Error-weighted distribution of μ as a function of ![]() . The color scale represents normalized weighted density, with brighter colors indicating higher density regions. A weighted linear regression demonstrates a moderate negative correlation between profile shape and spin-down energy loss rate. Only measurements with −2 < μ < 2 are included in this analysis.
. The color scale represents normalized weighted density, with brighter colors indicating higher density regions. A weighted linear regression demonstrates a moderate negative correlation between profile shape and spin-down energy loss rate. Only measurements with −2 < μ < 2 are included in this analysis.
Current usage metrics show cumulative count of Article Views (full-text article views including HTML views, PDF and ePub downloads, according to the available data) and Abstracts Views on Vision4Press platform.
Data correspond to usage on the plateform after 2015. The current usage metrics is available 48-96 hours after online publication and is updated daily on week days.
Initial download of the metrics may take a while.