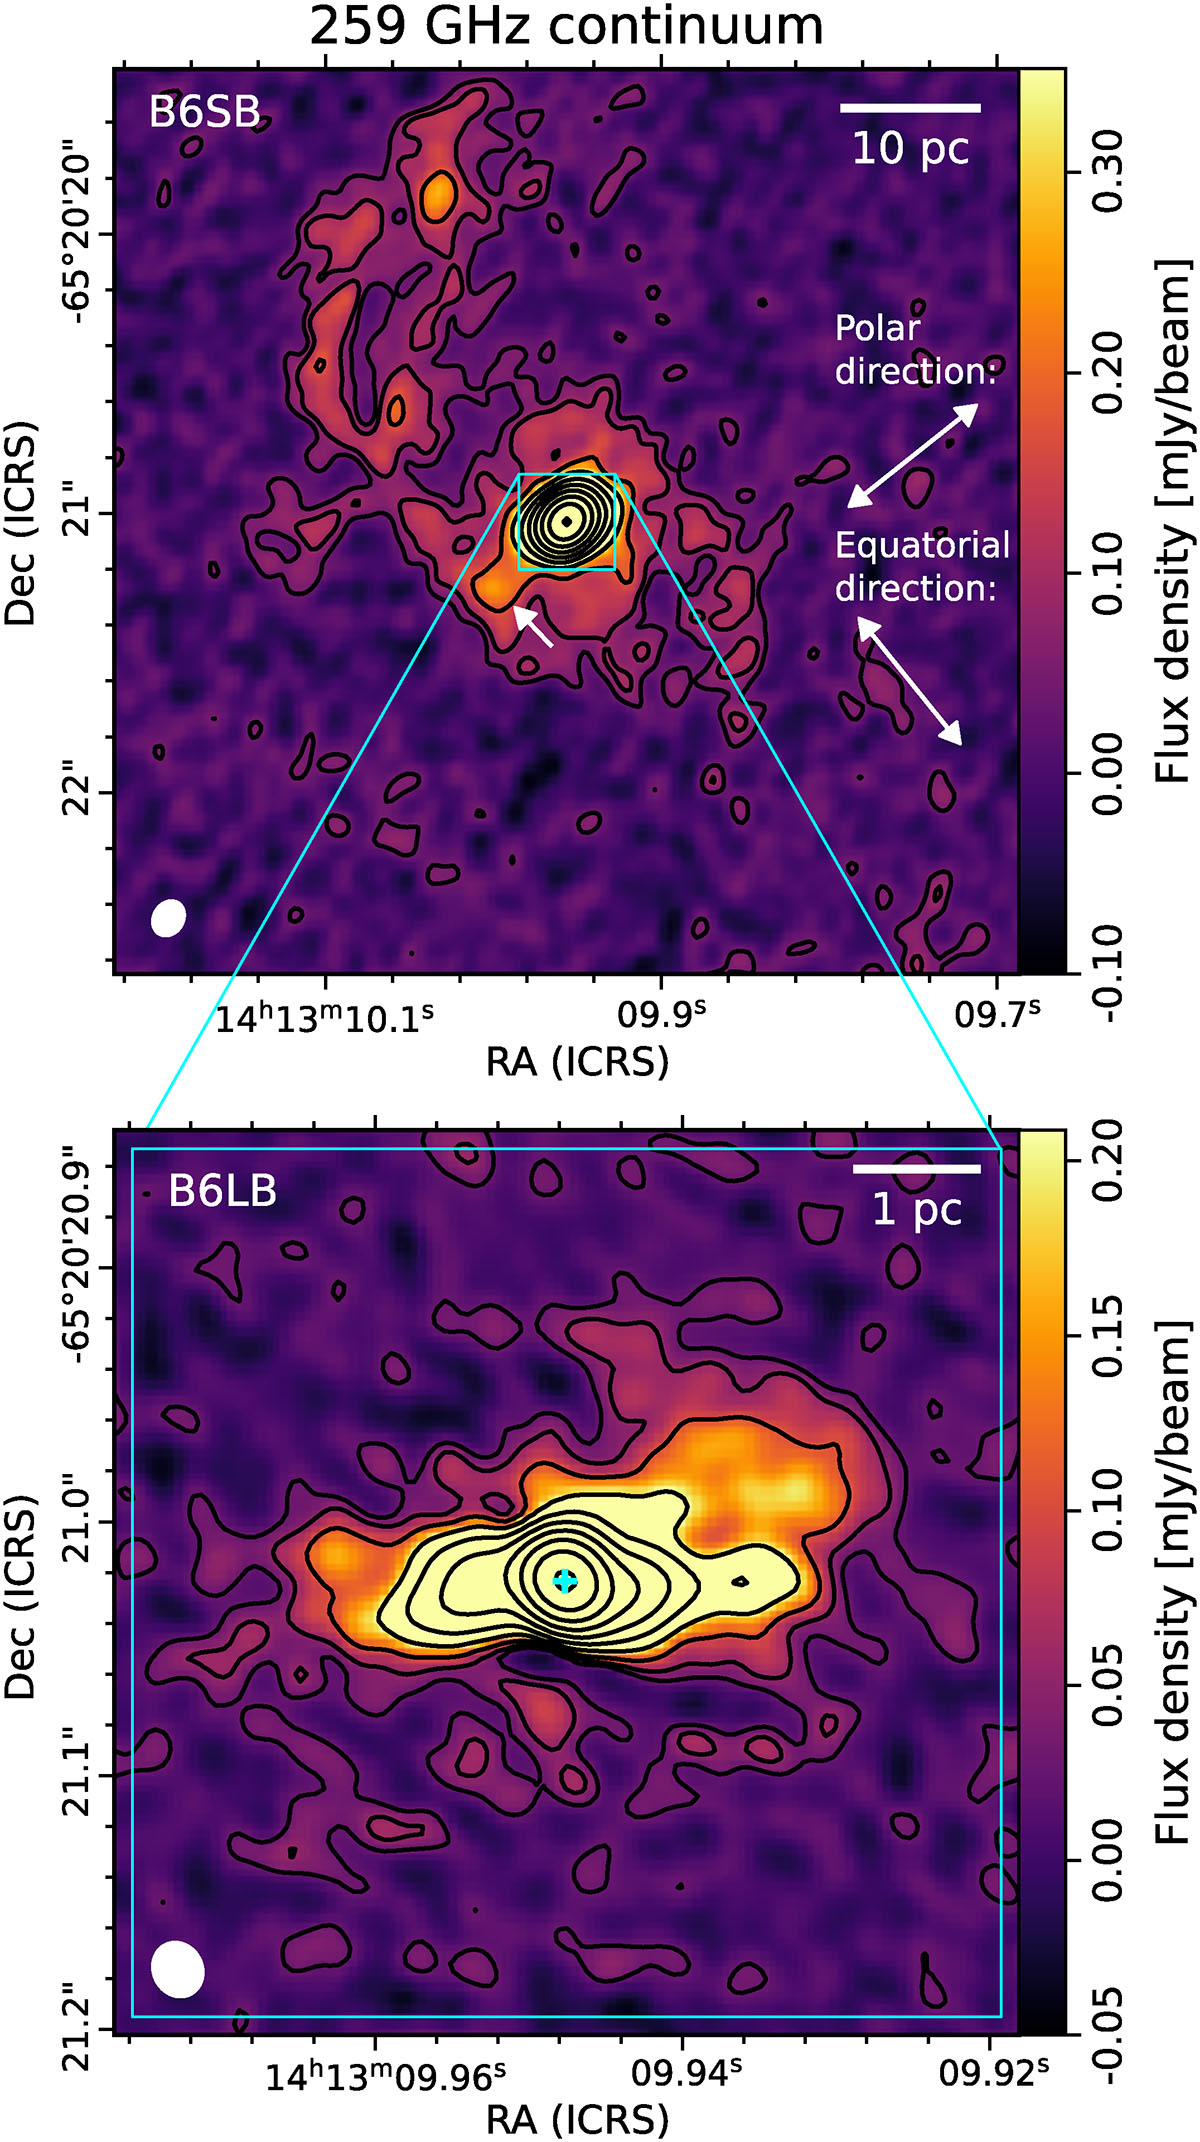
Fig. 1.
Download original image
Band 6 short (top) and long (bottom) baseline continuum maps at 259 GHz. Contour levels are drawn at [2, 4, 8, 16, 32, 64, 128, 256, 512, 1024] × rms, where the background rms equals 0.022 mJy/beam in the B6SB map and 0.013 mJy/beam in the B6LB map. The synthesised beam sizes are drawn in the bottom left as filled ellipses, and the cyan cross indicates the AGN position (as defined in Sect. 3.4). The phoenix feature is indicated with a white arrow. The polar and equatorial directions mentioned throughout the text are shown in the upper panel.
Current usage metrics show cumulative count of Article Views (full-text article views including HTML views, PDF and ePub downloads, according to the available data) and Abstracts Views on Vision4Press platform.
Data correspond to usage on the plateform after 2015. The current usage metrics is available 48-96 hours after online publication and is updated daily on week days.
Initial download of the metrics may take a while.