Fig. A.2.
Download original image
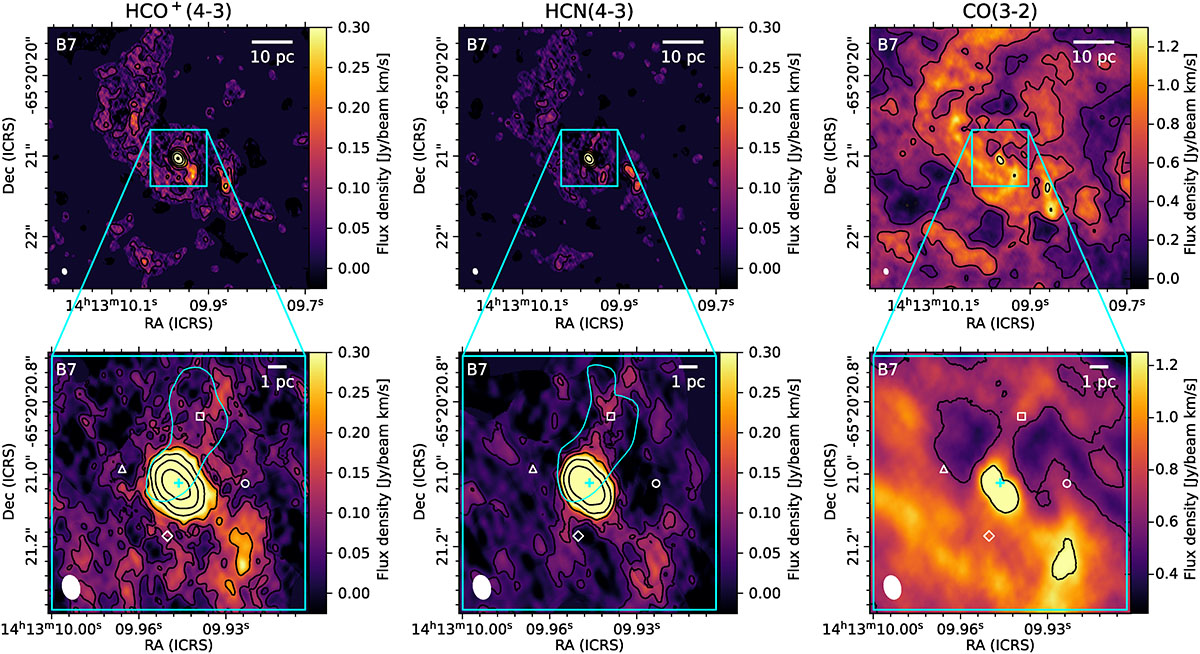
Band 7 HCO+(4-3) (νrest = 356.7 GHz), HCN(4-3) (νrest = 354.5 GHz), and CO(3-2) (νrest = 345.8 GHz) moment zero maps. We observe spiral structure in the CND that connects to the torus in all three transitions, with the bottom panels showing the inner bars of these hooks. Contour levels are drawn at [1, 2, 4, 8, 16, 32] × 50 mJy/beam km s−1 in the HCO+(4-3) and HCN(4-3) maps and at [1, 2, 4] × 300 mJy/beam km s−1 in the CO(3-2) maps. Cyan contours in the bottom left and middle panels indicate the position of the blueshifted emission feature discussed in Sect. 4.5 and represent the −30 km s−1 level in right panels of Fig. 8 for HCO+(3-2) and HCN(3-2), respectively. The synthesised beam sizes are drawn in the bottom left as filled ellipses, and the cyan cross indicates the AGN position. Indicated on the bottom panels are also the four locations where the 1D kinematic profiles from Fig. 10 were extracted using corresponding symbols in white. To boost the S/N in the moment zero maps, we applied a custom masking algorithm for the HCO+(4-3) and HCN(4-3) maps that conservatively masks out empty regions in the image cube. For CO(3-2), we masked out negative values in the image cube to remove artefacts caused by large scale emission that exceeds the maximal recoverable scale. Since this causes an upward bias in the flux density, the resulting CO(3-2) moment zero map is unsuitable for quantitative flux measurements.
Current usage metrics show cumulative count of Article Views (full-text article views including HTML views, PDF and ePub downloads, according to the available data) and Abstracts Views on Vision4Press platform.
Data correspond to usage on the plateform after 2015. The current usage metrics is available 48-96 hours after online publication and is updated daily on week days.
Initial download of the metrics may take a while.