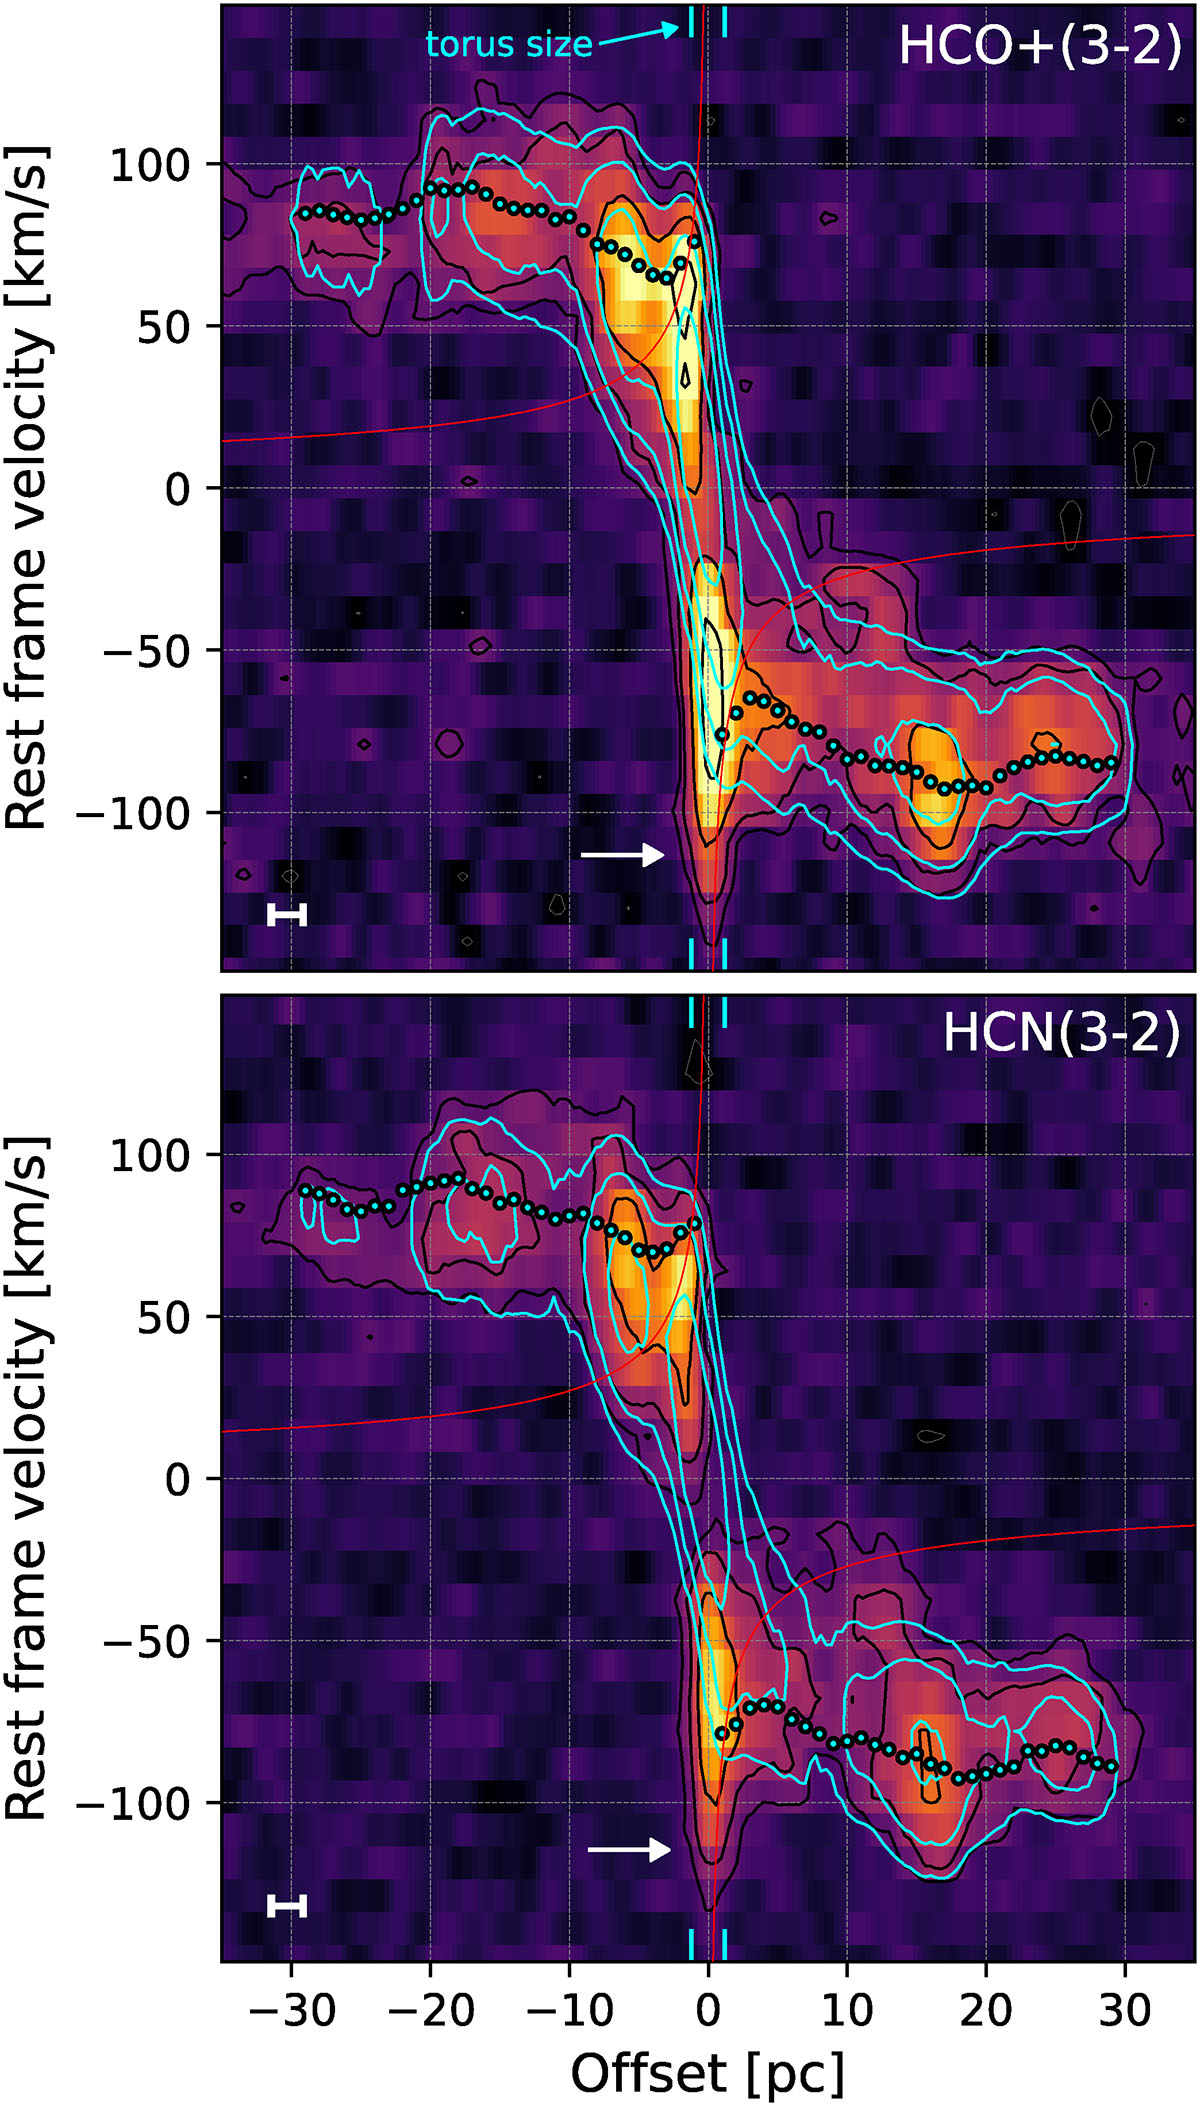
Fig. C.1.
Download original image
Position-velocity (PV) diagrams along the major axis for HCO+(3-2) (top, PA = 216°) and HCN(3-2) (bottom, PA = 217°) in the B6SB dataset. The colour map and black contours represent the data, and the cyan contours represent the model. Both sets of contours are drawn at [1, 2, 4, 8]×1.5 mJy/beam. Overlaid on the PV diagrams are also the fitted line-of-sight velocities VLOS = sin(i)×Vrot using cyan circles and the theoretical Keplerian profile of a central SMBH with a mass of M• = 1.7 × 10⁶ M⊙ (Greenhill et al. 2003) using a solid red curve. The size of the torus, which is barely resolved in B6SB, is indicated on the edges of each panel using vertical cyan markers. A white arrow is drawn in both panels to indicate the location of a < − 100 km s−1 blueshifted emission component in the data that is not replicated by the model. The synthesised beam sizes are shown in the bottom left as white bars.
Current usage metrics show cumulative count of Article Views (full-text article views including HTML views, PDF and ePub downloads, according to the available data) and Abstracts Views on Vision4Press platform.
Data correspond to usage on the plateform after 2015. The current usage metrics is available 48-96 hours after online publication and is updated daily on week days.
Initial download of the metrics may take a while.