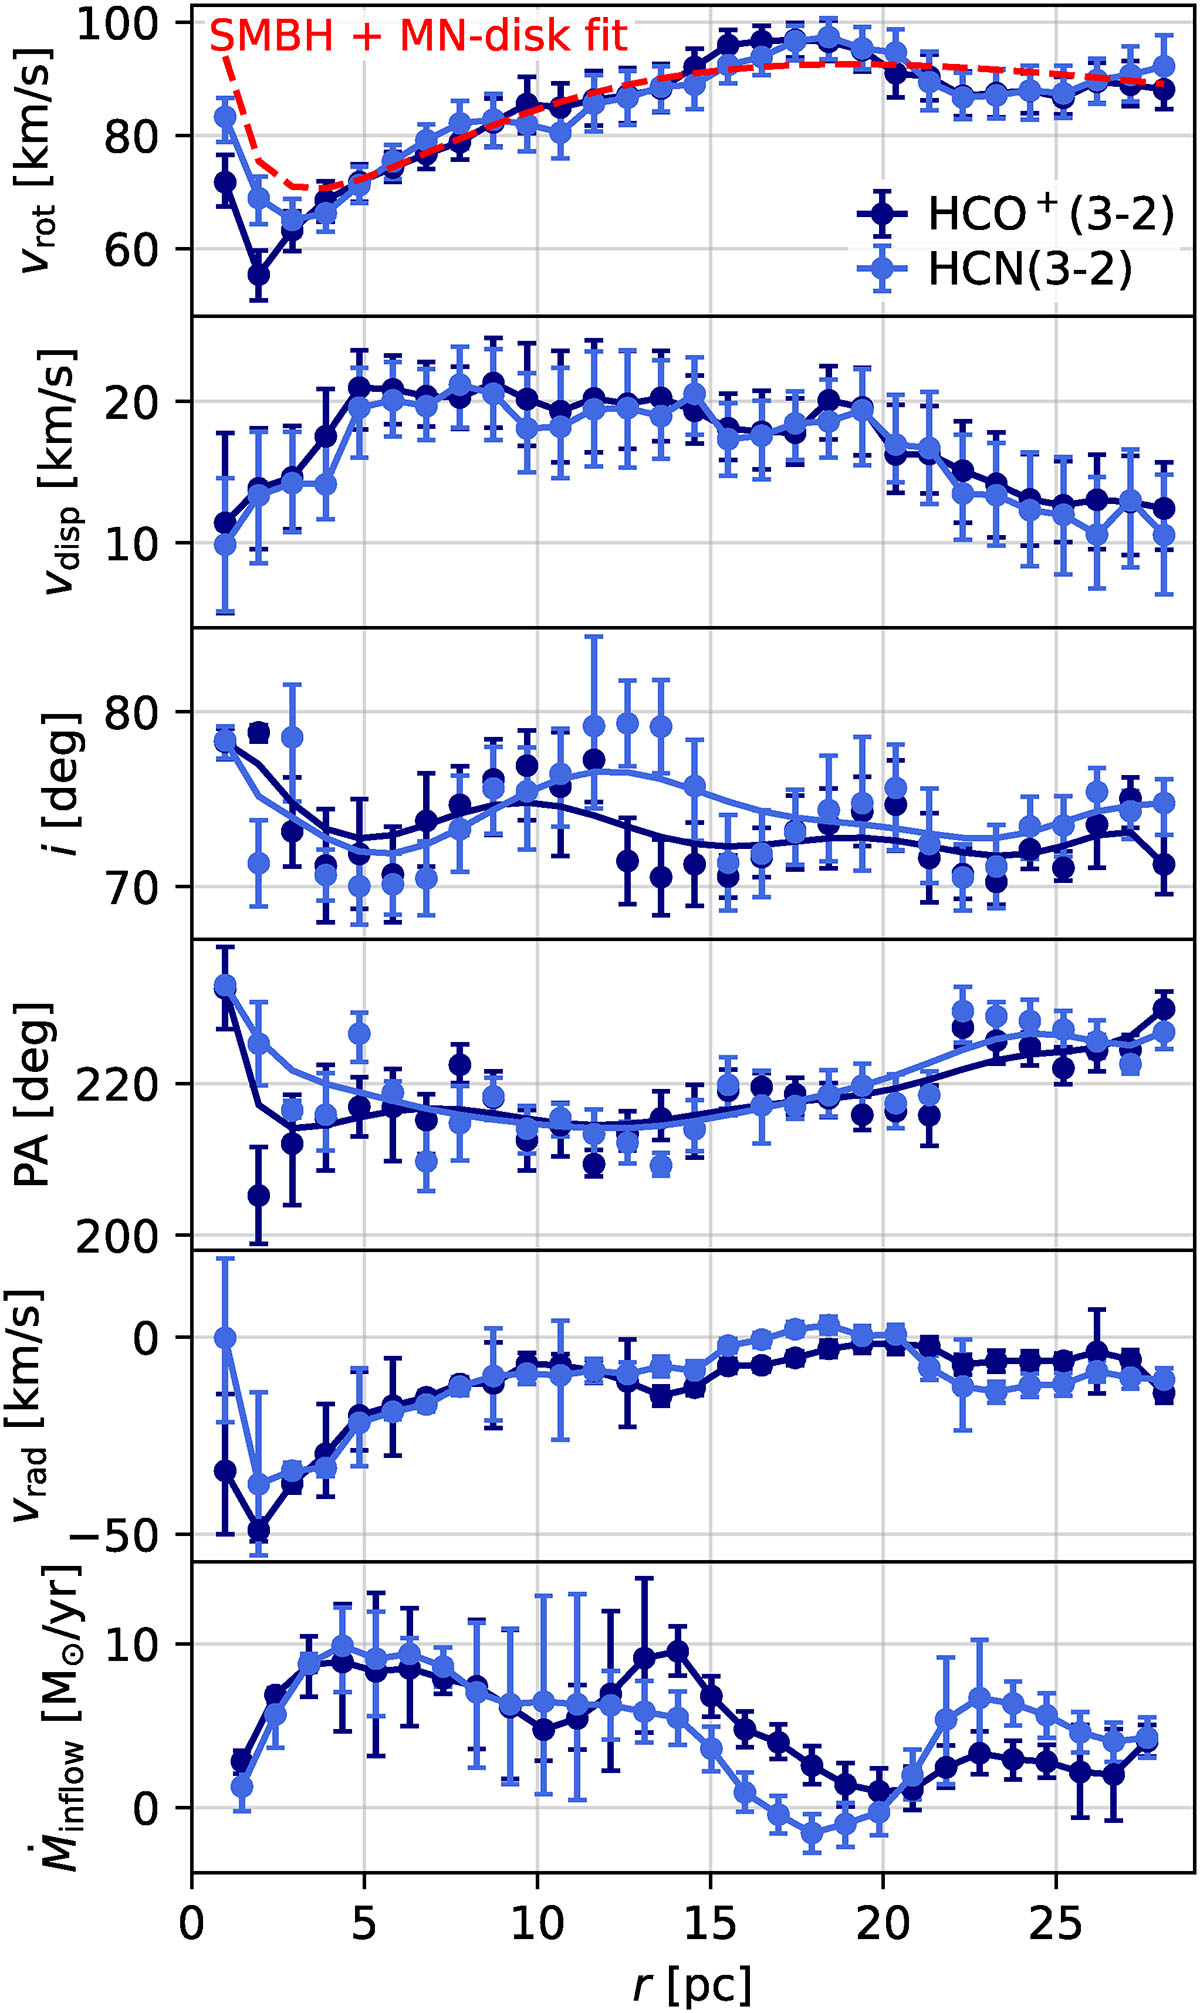
Fig. C.2.
Download original image
Same as Fig. 9, but for Vrad left as a free parameter. The fitted radial Vrad profile is shown in the fifth panel, where we define Vrad such that negative (positive) values imply inflow (outflow). In the bottom panel, we show the radial inflow rate that results from multiplying Vrad(r) by the radial mass distribution dMMN(r)/dr of the SMBH + Miyamoto-Nagai disc model (dashed red curve in the top panel, which was fitted to the rotation curve for Vrad = 0, see Sect. 4.5.1).
Current usage metrics show cumulative count of Article Views (full-text article views including HTML views, PDF and ePub downloads, according to the available data) and Abstracts Views on Vision4Press platform.
Data correspond to usage on the plateform after 2015. The current usage metrics is available 48-96 hours after online publication and is updated daily on week days.
Initial download of the metrics may take a while.