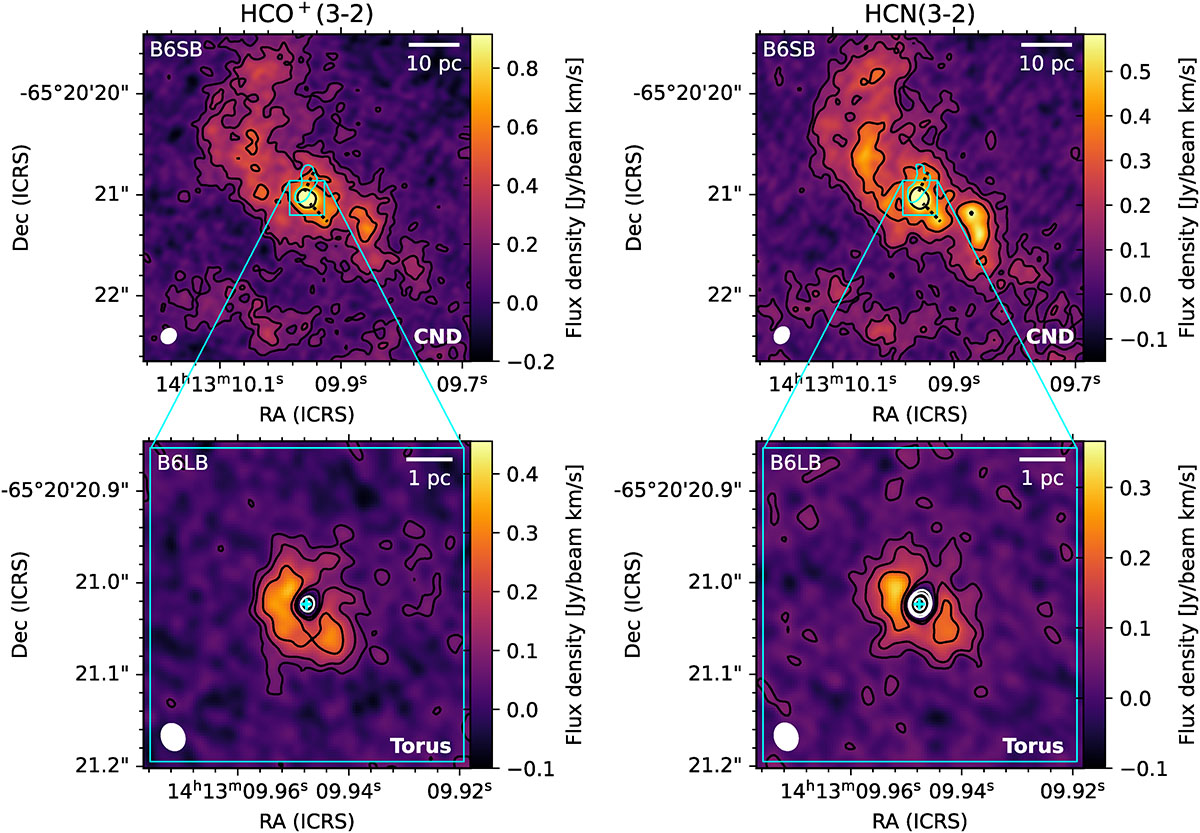
Fig. 3.
Download original image
Band 6 HCO+(3-2) (νrest = 267.6 GHz) and HCN(3-2) (νrest = 265.9 GHz) short (top, covering the CND) and long (bottom, showing the resolved torus) baseline moment zero maps. Contour levels are drawn at [ − 16, −8, −4, 2, 4, 8, 16] × rms, where the background rms equals 36, 23, 57 and 28 mJy/beam km/s in the HCO+(3-2) B6SB and B6LB and HCN(3-2) B6SB and B6LB maps, respectively. White contours represent negative flux density values and indicate the position of an absorption hole that coincides with the continuum peak. The L-shape that contains the NW and SW hooks as discussed in the text is drawn as dashed black lines in the top panels. Cyan contours in the top panels indicate the position of the blueshifted emission feature discussed in Sect. 4.5 and represent the −30 km s−1 level in the right panels of Fig. 8. The synthesised beam sizes are drawn in the bottom left as filled ellipses, and the cyan cross indicates the AGN position.
Current usage metrics show cumulative count of Article Views (full-text article views including HTML views, PDF and ePub downloads, according to the available data) and Abstracts Views on Vision4Press platform.
Data correspond to usage on the plateform after 2015. The current usage metrics is available 48-96 hours after online publication and is updated daily on week days.
Initial download of the metrics may take a while.