Fig. 4.
Download original image
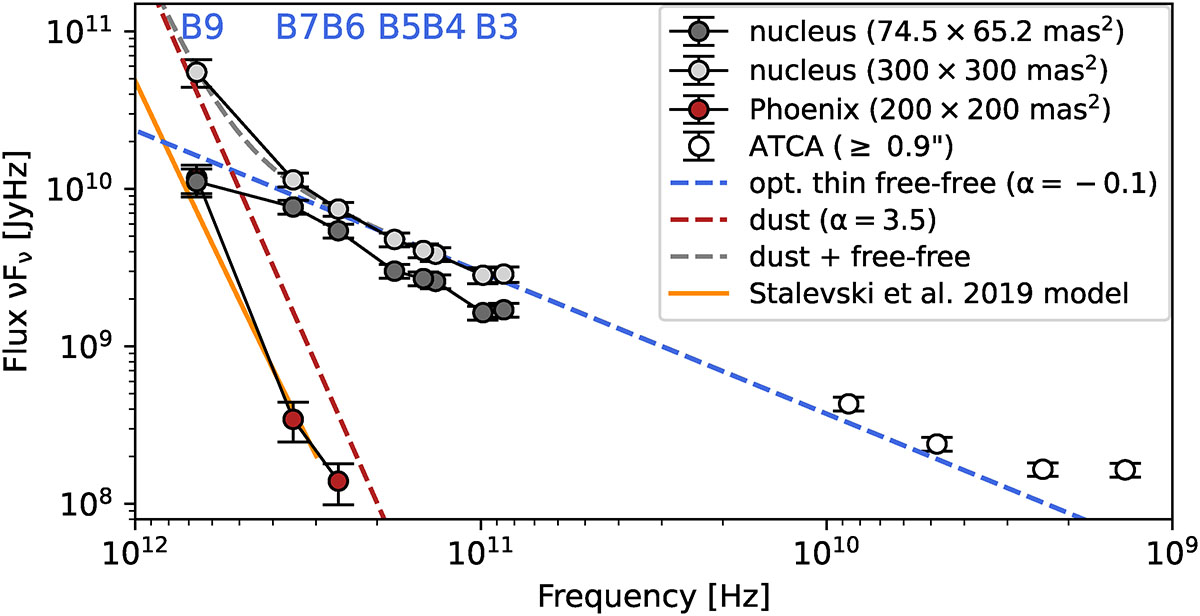
Spectral energy distribution of the Circinus AGN for the three apertures drawn in Fig. 5. Also shown are four ATCA measurements at varying beam sizes (Elmouttie et al. 1998) in white. The dashed lines represent a power-law (Fν ∝ να) fit of the 300 mas nuclear aperture containing both a dust component with α = 3.5 and a free-free component with α = −0.1. We also plot the nuclear dust model by Stalevski et al. (2019) in orange.
Current usage metrics show cumulative count of Article Views (full-text article views including HTML views, PDF and ePub downloads, according to the available data) and Abstracts Views on Vision4Press platform.
Data correspond to usage on the plateform after 2015. The current usage metrics is available 48-96 hours after online publication and is updated daily on week days.
Initial download of the metrics may take a while.