Fig. 5.
Download original image
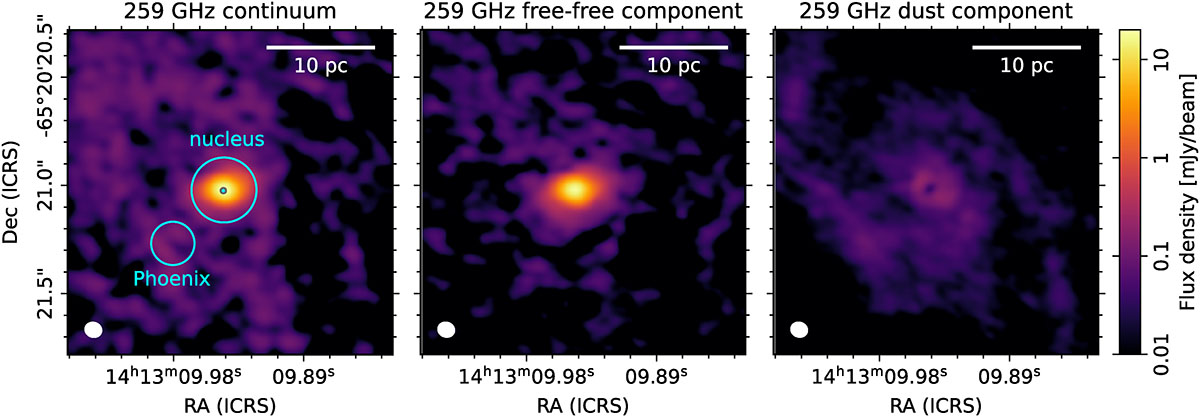
Band 6 (259 GHz) continuum decomposed into a free-free (α = −0.1) and a dust (α = 3.5) component based on pixel-by-pixel SED-fitting. The common beam size between all maps used for these SED fits is drawn in the bottom left as a filled ellipse. In the left figure, we indicate the Phoenix and the two nuclear apertures used to obtain the spectral energy distribution shown in Fig. 4.
Current usage metrics show cumulative count of Article Views (full-text article views including HTML views, PDF and ePub downloads, according to the available data) and Abstracts Views on Vision4Press platform.
Data correspond to usage on the plateform after 2015. The current usage metrics is available 48-96 hours after online publication and is updated daily on week days.
Initial download of the metrics may take a while.