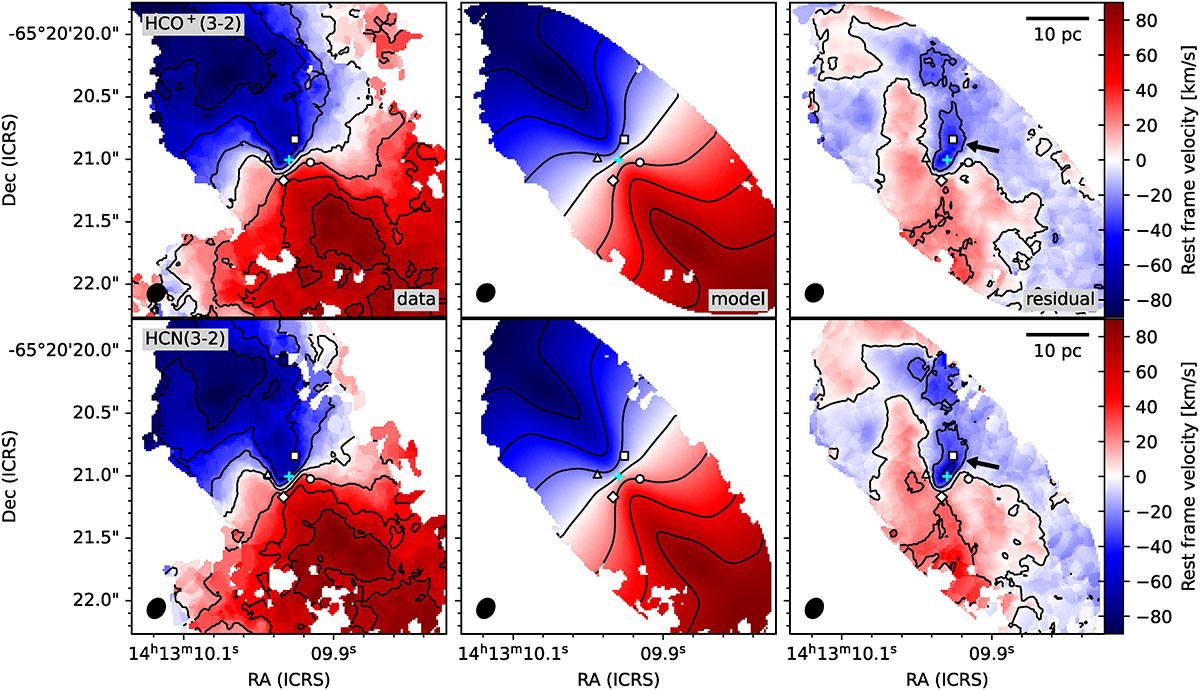
Fig. 8.
Download original image
Velocity fields of the CND for HCO+(3-2) (top) and HCN(3-2) (bottom) from the B6SB dataset as observed (left), as modelled using 3DBAROLO (middle) and the residual velocity field that results from subtracting the model from the data (right). The black arrows in the right panels indicate the position of the blue residual feature that coincides with the position of the NW hook. Velocity contour levels are drawn at [ − 75, −50, −25, 0, 25, 50, 75] km s−1. The rest frame velocity is defined relative to Vsys = 441.4 km s−1. Indicated on all maps are the point apertures used to extract the 1D kinematic profiles shown in Fig. 10 using corresponding symbols in white. The synthesised beam sizes are drawn in the bottom left as filled ellipses, and the cyan cross indicates the AGN position.
Current usage metrics show cumulative count of Article Views (full-text article views including HTML views, PDF and ePub downloads, according to the available data) and Abstracts Views on Vision4Press platform.
Data correspond to usage on the plateform after 2015. The current usage metrics is available 48-96 hours after online publication and is updated daily on week days.
Initial download of the metrics may take a while.