Fig. 4.
Download original image
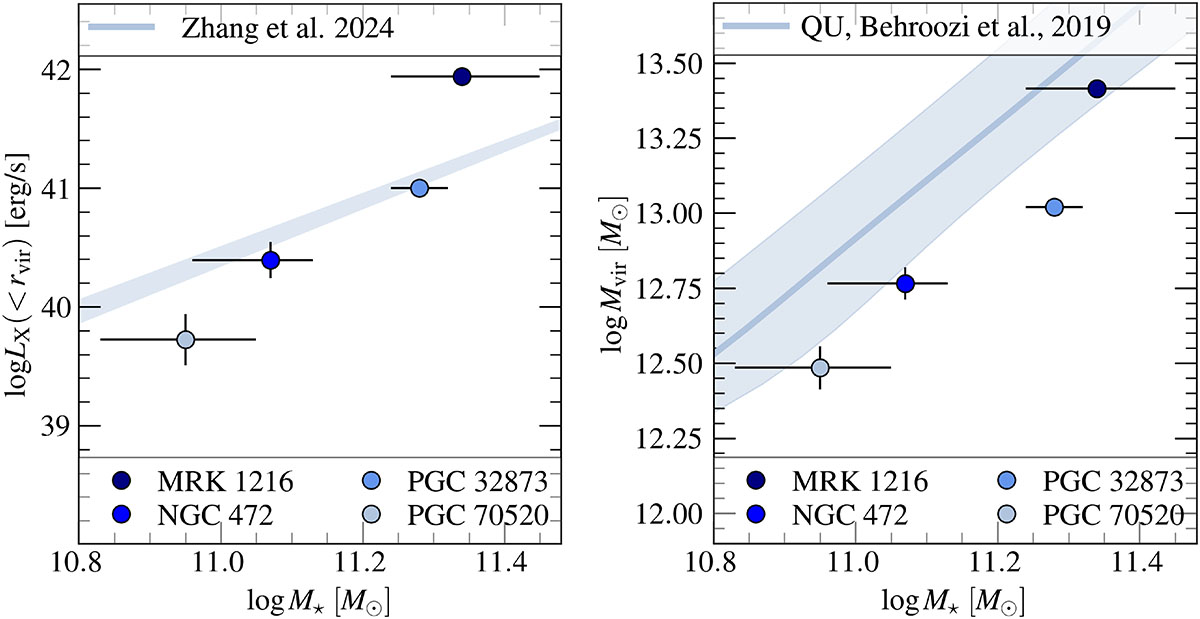
Left: 0.5 − 2 keV MOS1 CGM luminosity of the cE galaxies with detected X-ray emission within rvir as a function of their stellar mass. The shaded region shows the best-fit relation and its 1σ uncertainty from Zhang et al. (2024). Right: Virial mass of cEs calculated from the 0.5 − 2 keV CGM luminosity as a function of stellar mass. The shaded region shows the best-fit relation at z = 0 with its 1σ confidence interval from Behroozi et al. (2019). Overall, based on X-ray measurements, the cEs largely follow both the M★ − LX and the M★ − Mvir relations established for the local galaxy population, however, their virial mass is on the lower side of expectations, possibly hinting at a more compact halo structure.
Current usage metrics show cumulative count of Article Views (full-text article views including HTML views, PDF and ePub downloads, according to the available data) and Abstracts Views on Vision4Press platform.
Data correspond to usage on the plateform after 2015. The current usage metrics is available 48-96 hours after online publication and is updated daily on week days.
Initial download of the metrics may take a while.