| Issue |
A&A
Volume 704, December 2025
|
|
|---|---|---|
| Article Number | A196 | |
| Number of page(s) | 10 | |
| Section | Extragalactic astronomy | |
| DOI | https://doi.org/10.1051/0004-6361/202555575 | |
| Published online | 09 December 2025 | |
X-ray properties of massive compact relic galaxies
1
Department of Theoretical Physics and Astrophysics, Faculty of Science, Masaryk University, Kotlářská 2, Brno 611 37, Czech Republic
2
Center for Astrophysics | Harvard & Smithsonian, 60 Garden Street, Cambridge, MA 02138, USA
3
SRON Netherlands Institute for Space Research, Niels Bohrweg 4, 2333 CA Leiden, The Netherlands
★ Corresponding author: This email address is being protected from spambots. You need JavaScript enabled to view it.
Received:
19
May
2025
Accepted:
29
October
2025
Abstract
We present the X-ray analysis of seven local compact elliptical galaxies (cEGs), selected for their morphological resemblance to high-redshift red nuggets. As likely descendants of the red nugget population, cEGs offer a unique window into the early Universe, enabling the study of early galaxy evolution and the interplay between black holes, stellar bulges, and dark matter halos. Using data from Chandra and XMM-Newton, we investigate the properties of the hot gaseous halos in cEGs. Two galaxies – MRK 1216 and PGC 32873 – host luminous, spatially extended X-ray atmospheres, allowing us to derive radial thermodynamic profiles. For MRK 1216, we performed high-resolution spectral modeling with RGS data, which hints at super-solar α/Fe abundance ratios. The remaining galaxies show either faint or undetected X-ray halos, though several display AGN-like (active galactic nucleus) power-law emission. In the context of local scaling relations, cEGs show only mild deviations from the general galaxy population, exhibiting a slightly steeper M★ − LX relation and occupying the lower boundary of the M★–Mvir relation. These trends suggest that high-redshift red nuggets may also host a diverse range of X-ray atmospheres. We speculate that the compactness of cEGs may trace back to the population of ‘little red dots’ (LRDs), hinting at a potential link between LRDs, red nuggets, and compact relic galaxies in the local Universe.
Key words: galaxies: elliptical and lenticular, cD / galaxies: evolution / galaxies: formation / X-rays: galaxies
© The Authors 2025
 Open Access article, published by EDP Sciences, under the terms of the Creative Commons Attribution License (https://creativecommons.org/licenses/by/4.0), which permits unrestricted use, distribution, and reproduction in any medium, provided the original work is properly cited.
This article is published in open access under the Subscribe to Open model. This email address is being protected from spambots. You need JavaScript enabled to view it. to support open access publication.
1. Introduction
According to cosmological simulations, the core of massive, early-type galaxies forms through a rapid dissipative collapse (z > 2), with subsequent evolution to massive early-type galaxies through mergers (z > 0) (Oser et al. 2010). Due to the stochasticity of the second phase, a small fraction of the collapsed cores could avoid mergers, leading to the formation of red nuggets observed at 1 < z < 2 (Damjanov et al. 2009). During their further evolution, red nuggets may continue their undisturbed evolution, resulting in a rare population of massive, compact relic galaxies (Quilis & Trujillo 2013) with only a small number of confirmed cases in the local universe (Trujillo et al. 2014; Ferré-Mateu et al. 2017). The estimated fraction of massive galaxies that formed at z > 2 and survived structurally intact to z ∼ 0. is < 2% (Quilis & Trujillo 2013; Wellons et al. 2015).
Local relic galaxies are outliers in the mass−size relation of local ellipticals: despite their massive nature (M★ ≳ 1011 M⊙) they are extremely compact (reff ≲ 2 kpc) and host a very old (≳13 Gyr) and passive (red) stellar population. Their red and compact nature also resembles the ‘little red dot’ (LRD) galaxy population, which is abundant in the z ≥ 4 Universe; however, unlike typical LRDs, these galaxies do not exhibit the peculiar V-shaped spectral energy distribution (SED) characteristics of that population.
Local relics may be more complex than their optical appearance suggests, and exploring them across other wavelengths could offer a deeper understanding of their nature and origin. X-ray observations, in particular, provide valuable insights into their large-scale dark matter halos. Indeed, Chandra observations revealed that two compact relic galaxies, MRK 1216 and PGC 32873, host extended, luminous X-ray atmospheres (Buote & Barth 2018, 2019; Werner et al. 2018), implying that these galaxies reside in massive dark matter halos. Although both sources are isolated, they exhibit very different X-ray properties (Werner et al. 2018), revealing that the population of local relics is less homogeneous than their optical appearance suggests.
MRK 1216 and PGC 32873 have also been proposed to host over-massive black holes at their center (Ferré-Mateu et al. 2015; Werner et al. 2018). In fact, Ferré-Mateu et al. (2015) suggested that massive relic galaxies, by their very nature, host over-massive black holes: After the dissipative collapse of the core and the formation of the central supermassive black hole (BH), the galaxy does not go further in mass or size, thereby preventing the stellar bulge from catching up to its initially over-massive BH. In addition, X-ray studies show that nearby galaxies with over-massive BHs, such as NGC 1332 and NGC 4342, tend to reside in extended dark matter (DM) halos (Bogdán et al. 2012a; Werner et al. 2018; Buote & Barth 2019). Given the strong correlation between DM halo mass and BH mass, these findings suggested that BH growth is governed by the large-scale DM halo, and challenged the bulge–BH coevolution (e.g. Bogdán et al. 2024; Kovács et al. 2024). The presence of extended DM halos also implies that the compact nature of MRK 1216 and PGC 32873 is not a result of tidal stripping, as the DM halo would be stripped before the stellar component due to its low specific binding energy (Libeskind et al. 2011).
Overall, local relic galaxies, with their growth ceased at z ∼ 2, offer a glimpse into the early Universe and a unique opportunity to study early galaxy evolution and the interplay between different galactic components: the BH, the stellar bulge, and the DM halo. In this paper, we analyze Chandra and XMM-Newton observations to investigate the X-ray atmospheres of seven compact elliptical galaxies (cEGs) in the local Universe, including two confirmed local relics, Mrk 1216 and PGC 32873. We infer total masses from X-ray luminosities, estimate black hole masses from velocity dispersions, and adopt stellar masses from HST data, placing these in the context of local scaling relations. In addition, we derive the radial profiles of thermodynamic properties for both MRK 1216 and PGC 32873, and perform spectral modeling of the high-resolution RGS data for MRK 1216.
This paper is structured as follows. Section 2 introduces the galaxy sample. Section 3 outlines the data reduction process. Section 4 presents the analysis and results, including point source identification (Section 4.1), source characterization (Section 4.2), analysis of diffuse emission (Section 4.3), surface brightness and thermodynamic profiles (Sections 4.4 and 4.5), and the high-resolution spectrum of MRK 1216 (Section 4.6). A discussion is presented in Section 5, including a comparison with the general galaxy population (Section 5.1) and the connection to LRDs (Section 5.1). A summary of the findings are given in Section 6.
We adopt a standard ΛCDM (Λ cold dark matter) cosmology throughout the analysis. The adopted parameters are H0 = 71 km−1 s−1 Mpc−1, ΩM = 0.27, and ΩΛ = 0.73.
2. Sample
In this work, we study seven nearby cE galaxies. To construct a comprehensive sample, our targets were drawn from two distinct samples, with each subset exhibiting the typical characteristics of the relic population.
A subset of four galaxies is derived from the optically selected sample of Yıldırım et al. (2017). This parent sample features 16 local cEs with detailed Hubble Space Telescope (HST)-based measurements of their stellar mass, size, and structural and dynamical properties. To select our sample, we first investigated the environment of the galaxies. Interestingly, simulations (Peralta de Arriba et al. 2016) and observations (Buitrago et al. 2018) suggest that low-redshift massive relic galaxies are more common in rich environments (e.g. NGC1277 (Trujillo et al. 2014), the prototypical relic galaxy near the center of Perseus cluster) than in isolation. As early members of their clusters, they tend to be centrally located with high relative velocities, which lowers their merger rates and allows them to remain intact. However, tidally stripped galaxies, with otherwise conventional evolutionary paths, can mimic some of the main optical characteristics of low-redshift relics. Stripping and merging events are more common in dense cluster environments, where the level of X-ray emission from the intra-cluster medium may surpass that of individual galaxies, hampering the study of their X-ray atmospheres. Therefore, from the parent sample, we selected only those galaxies that reside in low-density environments, as these provide a cleaner and less contaminated sample compared to those in rich environments. Environmental features (cluster and group environment, or interaction with another galaxy) narrowed the parent sample down to four galaxies: MRK 1216, NGC 422, PGC 32873, and PGC 70520 (Table 1). Among these, MRK 1216 and PGC 32873 have already been the subjects of previous X-ray studies (Buote & Barth 2018; Werner et al. 2018); however, additional observations acquired since then allow for a more in-depth analysis.
Galaxy properties.
We extended the sample by incorporating three additional X-ray luminous cE galaxies at z < 0.1 (J091842.83+031557.1, J092318.89+025538.3, and J093634.60+034428.4) from the 140 deg2eROSITA Final Equatorial Depth Survey (eFEDS) field that have relatively high velocity dispersions and stellar masses (Table 1). This extension aims to build a more comprehensive sample of X-ray-detected cE galaxies and may serve as a pathfinder for future studies targeting X-ray-selected compact systems with extended hot halos. Note that these three galaxies lie beyond the 112 Mpc distance limit of the Yıldırım et al. (2017) sample and were therefore not included in their selection. Based on SDSS data, the morphology and color indices (u − r = 2.82 − 3.00) indicate that these are early-type galaxies. Their effective radii are ∼50% smaller than expected for their mass at low redshift, but align with those of z ∼ 2 galaxies. A cone search and cross-correlation with the eROSITA eFEDS cluster and group catalog (Liu et al. 2022) confirm that the target galaxies are isolated sources, indicating passive evolution. Together, these characteristics suggest their classification as red nugget analogs. The presence of a luminous X-ray halo in these galaxies was suggested by the eROSITA X-ray observations. As a caveat, we note that eROSITA’s broad point spread function (PSF) limits resolution.
Thus, the complete sample consists of seven galaxies; their properties and X-ray observational log are detailed in Table 1 and Table 2, respectively. Table 1 also lists the number of neighboring galaxies within 200 kpc based on the Radial Velocity Constrained Cone Search tool in NED. While NGC 472 and PGC 32873 each have one such neighbor, their stellar masses – estimated based on NIR magnitudes from the formula of Bell et al. (2003) – are about 3 orders of magnitude lower than that of the target galaxy. The remaining galaxies have no companions within the search radius. This indicates that our targets lack close, massive companions. For the most massive systems, MRK 1216 and PGC 32873, we repeated the cone search with an increased search radius of 1 Mpc, yielding a total of three and five neighboring galaxies, respectively. These companions span stellar masses from the dwarf-galaxy regime (≲108 M⊙) to intermediate-mass galaxies (∼1010 M⊙), i.e., at least 1 order of magnitude lower than the central galaxies.
Observational log.
3. Data reduction
We carried out an X-ray analysis on a combination of Chandra ACIS-S, Chandra HRC-I, and XMM-Newton observations incorporating all available X-ray data of the targets (Table 2). After retrieving the data, we performed all subsequent processing with the CIAO software packages (Chandra Interactive Analysis of Observations, version 4.13, Fruscione et al. 2006, CALDB version 4.9.5) and the XMM-SAS software packages (Science Analysis System, version 20.0.0, Gabriel 2017). We followed the standard data processing described, for example, in Kovács et al. (2023) and Bogdán et al. (2017) to prepare the X-ray observations for analysis. Specifically, for Chandra, we reprocessed the data using chandra_repro to ensure consistent calibration corrections across all observations, followed by the identification and removal of flare-contaminated intervals. For EPIC data, we additionally filtered out bad pixels, bad columns, cosmic rays, and events outside the FOV (field of view). From the reprocessed and cleaned data, we extracted energy-filtered event files and images, as well as exposure maps to correct for vignetting and variations of quantum efficiency across the CCD. For the imaging analysis, the EPIC data were processed separately for each observation and detector, while the Chandra data were merged from multiple observations. Spectra were extracted from individual observations and the resulting spectra and response files were subsequently combined for ACIS data.
The XMM-Newton RGS data for MRK 1216 were extracted following the data processing steps described in de Plaa et al. (2017). The RGS spectrum has been extracted from a 0.5 arcmin-wide region in cross-dispersion direction to probe the X-ray brightest central part of the system. Because the RGS operates without a slit, every line is broadened by the spatial extent of the source. To account for this broadening in our model, we convolved the RGS response with the surface brightness profile of the galaxy derived from the EPIC/MOS1 image in the 0.5 − 1.8 keV (7 − 25 Å) band along the dispersion direction. However, because of the possible presence of intrinsic metallicity gradients, this surface brightness profile is not necessarily a perfect description of the observed line profile. Therefore, in our model, we multiplied the line profile by a scale factor s, which is the ratio of the observed line spread function (LSF) width to the expected LSF. We leave this scale factor as a free parameter in our fits.
Throughout the analysis, background subtraction was carried out using a local background region. This region was extracted from the same chip as the source emission.
4. Analysis and results
4.1. Point sources
For galaxies with XMM-Newton and Chandra HRC data (NGC 472 and PGC 70520), we primarily used the HRC observations to identify X-ray point sources, taking advantage of its superior spatial resolution (∼0.4″) compared to XMM-Newton. We ran the CIAO wavdetect source detection tool on the wide-band (∼0.1 − 10 keV)1 total counts mosaic of each galaxy, specifying six wavelet scales with values of 1, 1.414, 2, 2.828, 4, 8, and 16, and a signal threshold of < 10−5. A single point source was identified near the center of PGC 70520 with an offset of 0.27″. No further point sources were detected within 5 reff projected distance from these galaxies.
The flux of the point source was determined with the srcflux CIAO tool extracted within a circular region enclosing 90% of the PSF at 1.0 keV with the source’s PSF fraction estimated from MARX simulations (Davis et al. 2012). We applied an absorbed power-law model for the source spectrum with a photon index of Γ = 1.7, then converted to luminosity assuming that the source is associated with PGC 70520. We measured an HRC wide-band source luminosity of  on the merged data. Given this luminosity, the source emission most likely originates from a low-luminosity AGN, since LMXB luminosity functions typically cut off above 2 × 1039 erg s−1 (Irwin et al. 2003; Gilfanov 2004; Kim & Fabbiano 2004; Zhang et al. 2012).
We ran wavdetect on the merged broad-band ACIS images of those galaxies with Chandra ACIS data, MRK 1216 and PGC 32873, and identified one and two point sources, respectively, within 5 reff projected distances. These sources are likely background AGNs, as none of them are within 2 reff, where most of a galaxy’s optical light is concentrated. Note that the detection sensitivity is relatively high due to the presence of bright diffuse emission in these galaxies.
To identify point sources in the EPIC images, we ran wavdetect on individual observations for each camera in the 0.5–10 keV band, using a significance threshold of < 10−4 and wavelet scales following the “ sequence”, i.e., 1,
  , 2,
, 2,  , 4,
, 4,  , 8,
, 8,  , 16. We identified a point-like source at the coordinates of each galaxy.
4.2. Characterization of eFEDS galaxies observed only with XMM Newton
All three galaxies in our sample with only XMM-Newton EPIC data (J091842.83+031557.1, J092318.89+025538.3, and J093634.60+034428.4) show detectable X-ray emission, which is consistent with a point-like source. However, due to the broader XMM-Newton PSF, we performed additional tests to assess whether these sources are point-like or extended.
To infer the nature of the emission, we first compared the sources’ radial brightness profiles with the PSF using the eradial tool. We found that the 0.5 − 7 keV emission from all three galaxies is consistent with the nominal PSF, with no significant X-ray excess, suggesting that the sources are point-like.
We further investigated the emission by analyzing its spectral properties. For this, we calculated the galaxies’ hardness ratios, as spectral analysis was not feasible due to the faint nature of the sources (the brightest source has ≲45 net counts in the 0.5 − 7 keV band within 5 reff). We used the BEHR code (Park et al. 2006), and calculated the hardness ratio for each galaxy as a fractional difference defined by (H − S)/(H + S), where H and S are the source counts in the hard (2 − 10 keV) and soft (0.3 − 2 keV) bands. For reference, we performed the same calculation for simulated power-law and APEC spectra, each tailored to the observations corresponding to the galaxies. We used Xspec’s (Arnaud 1996) fakeit command along with the appropriate response files, assuming Γ = 1.7 for the power-law model, and kT = 0.3 keV and an abundance of 0.3 for the APEC model to perform the simulations. From the comparison of observed and simulated hardness ratios, we determined that all three sources exhibit predominantly power-law emission, suggesting that they are AGNs.
The X-ray emission of these galaxies is likely dominated by a central AGN. Studying their CGM requires separating this point source contribution. However, due to the broad on-axis PSF of XMM-Newton’s EPIC cameras (∼6″), which is comparable to the CGM extent observed in MRK 1216 and PGC 32873, the diffuse emission cannot be resolved in these systems.
4.3. Diffuse emission
To characterize the galaxies’ diffuse emission, we relied on ACIS and EPIC observations. For apertures with over 200 net counts within 5 reff (i.e., for MRK 1216 and PGC 32873), we extracted CCD spectra and calculated model fluxes; otherwise, we used aperture photometry on the imaging data. As the EPIC observations of the eFEDs targets are dominated by AGN emission and lack detectable diffuse emission (see Section 4.2, these sources are excluded from further analysis.
At each galaxy’s position, where the aperture contains fewer than 200 net counts (NGC 472 and PGC 70520), we performed photometric measurements of the 0.5 − 2 keV flux using circular apertures with a radius of 20 reff, while removing any overlapping point sources detected with wavdetect, i.e., those described in Section 4.1. Background was extracted from the same chip as the source emission. The flux-to-luminosity conversion was performed assuming APEC emission with Z = 0.6 Z⊙ (Anders & Grevesse 1989) and a temperature of kT = 0.5 keV.
In photometric measurements, the diffuse X-ray emission of galaxies is contaminated by the collective emission of unresolved low-mass X-ray binaries (LMXBs). Since LMXBs trace the stellar mass (Gilfanov 2004), their contribution can be estimated for the present sample. Using the LMXB luminosity function for nearby galaxies (Gilfanov 2004), and the stellar mass and distance of our targets, we estimated the luminosity contribution of unresolved LMXBs for both NGC 472 and PGC 70520, and applied the corresponding correction to the measured CGM luminosities (Table 3). Unresolved LMXBs are found to contribute, on average, roughly 40% of the 0.5 − 2 keV diffuse emission in these relatively faint X-ray galaxies. Note that we did not consider the contribution from high-mass X-ray binaries, as it is expected to be insignificant in galaxies with old stellar populations.
Unabsorbed X-ray luminosities of the galactic diffuse emission measured within 20 reff.
For the two brightest sources (MRK 1216 and PGC 32873), we extracted CCD spectra from ACIS and EPIC data within a single aperture of 20 reff, and calculated model fluxes. We fit the galaxies’ thermal emission spectrum with a phabs(apec+pow) model (in Xspec terminology), incorporating both the photon absorption, corresponding to the line-of-sight galactic hydrogen column density (Table 1), and the contribution of the unresolved cosmic X-ray background with a photon index fixed at Γ = 1.6. The spectral fits were performed using Xspec. In the Chandra ACIS fit, plasma temperature, abundance, and spectral normalizations were free parameters, whereas in the XMM-Newton EPIC fit, the abundance was fixed at the best-fit ACIS value. Note that allowing abundances to vary during the EPIC spectral fitting yields consistent results with those obtained using the fixed ACIS best-fit values. For the ACIS spectrum of MRK 1216 we applied a two-temperature model with the low-T component abundance linked to the abundance of the high-T component. The fit range was set to 0.5 − 7 keV for ACIS and 0.5 − 10 keV for XMM-Newton spectra. A joint fit was applied for the MOS1 and MOS2 data, while the PN data was separately modeled. The source luminosities and the best-fit spectral model parameters are listed in Table 3 and Table 4, respectively.
Best-fit spectral model parameters within 10 reff.
The measured X-ray luminosities of diffuse emission, shown in Table 3, vary widely among galaxies, covering a luminosity range of ≳2 orders of magnitude, highlighting the diversity of X-ray halos in the population of cE galaxies. In particular, MRK 1216 and PGC 32873 display the highest luminosities in the sample with their X-ray halo extending beyond their effective radii (Section 4.4, Figure 1). On the other hand, NGC 472 and PGC 70520, despite having comparable stellar masses and effective radii, lack prominent X-ray halos. We explore how these X-ray luminosities relate to local scaling relations in Section 5.1.
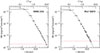 |
Fig. 1. Left: 0.3 − 2 keV surface brightness profile of MRK 1216. The parameters of the best-fitting β-model are β = 0.507 ± 0.003 and a core radius of rc = 0.874 ± 0.001 kpc. Right: 0.3 − 2 keV surface brightness profile of PGC 32873. The parameters of the best-fitting β-model are β = 0.526 ± 0.011 and rc = 0.492 ± 0.001 kpc. |
4.4. Surface brightness profile of MRK 1216 and PGC 32873
We extracted the 0.3 − 2 keV radial surface brightness profiles for MRK 1216 and PGC 32873, the brightest sources of the sample. The remaining galaxies had too few (< 50) counts for this analysis. Profile extraction and fitting were performed on ACIS data, with point sources removed, using the pyproffit software (Eckert et al. 2020). The extracted surface brightness profiles were fit with a single β-model:

where rc is the core radius of the gas distribution and B is the background level. The local background was estimated from an outer annulus centered on the galaxy. Given the Poissonian nature of the data, parameter estimation was performed using C-statistics. The background-subtracted profiles, along with the corresponding best-fit β-models, are displayed in Figure 1.
We trace the X-ray halos of MRK 1216 and PGC 32873 out to ∼10, reff and ∼4, reff, respectively. The best-fit core radius of the gas distribution is 0.874 ± 0.001 kpc for MRK 1216 and 0.492 ± 0.001 kpc for PGC 32873, with model slopes of β = 0.507 ± 0.003 and β = 0.526 ± 0.011, respectively. While these β values are typical for bright ellipticals with LX ≈ 1039 − 1042 erg s−1, the rc core radii are only a fraction of the typical rc ≈ 2 kpc (e.g. Goudfrooij & de Jong 1995).
4.5. Thermodynamic profiles
Following the method outlined in Kovács et al. (2023) and Zhu et al. (2023), we extracted X-ray spectra in concentric annuli from the ACIS data of MRK 1216 and PGC 32873, and derived the deprojected radial profiles of the thermodynamic properties of the CGM assuming a model described in Section 4.3 with the abundances fixed to the value obtained from the fit within 10 reff (Table 4). The extraction annuli were defined on a logarithmic scale, with each radial bin containing > 200 net counts. Due to its noncircular symmetry, elliptical annuli were used for PGC 32873. The thermodynamic profiles for MRK 1216 and PGC 32873 are displayed in Figure 2 and Figure 3, respectively. Note that the outermost data points of these profiles derived from the deprojection may be subject to systematic uncertainties, potentially due to morphological asymmetries or residual CGM emission beyond the extraction radius.
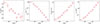 |
Fig. 2. Deprojected thermodynamic profiles of the CGM surrounding MRK 1216. The profiles, extracted from Chandra ACIS data, show temperature (kT), total density (n = ne + ni), entropy (K), and cooling time (tcool) extending out to ≳20 reff. The effective radius of MRK 1216 is reff = 3.0 kpc, corresponding to 6.8″. |
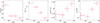 |
Fig. 3. Deprojected thermodynamic profiles of the CGM surrounding PGC 32873. The profiles, extracted from Chandra ACIS data, show temperature (kT), total density (n = ne + ni), entropy (K), and cooling time (tcool) extending out to ∼3 reff. The effective radius of PGC 32873 is reff = 2.3 kpc, corresponding to 4.4″. |
We obtained the kT temperature profiles directly from the best-fit 0.5 − 7 keV APEC model of each annulus, and derived the ne electron density from the model normalization, then expressed the n = ne + ni total density assuming ni = 0.92ne for the ion density. The  entropy and the tcool = 3/2(ne + ni)kT/(neniΛ(T)) cooling time of the plasma were calculated from these deprojected properties, where Λ(T) is the cooling function for solar metallicity; this assumption may lead to a slight underestimate of the cooling time in regions with subsolar abundance.
The kT profile of MRK 1216 shows a smooth decline with radius with a core temperature of 1.03 ± 0.04 keV, while PGC 32873 displays a more centrally peaked distribution with a slightly higher core temperature of 1.24 ± 0.20 keV. Similar central temperatures have been reported for giant ellipticals by Werner et al. (2012), Lakhchaura et al. (2018). The central electron density of MRK 1216, measured on a 0.5 kpc scale, is 0.51 ± 0.13 cm−3. This value exceeds the 0.11 ± 0.06 cm−3 central density measured for PGC 32873 within 1 kpc, which is consistent with the typical ∼0.1 cm−3 density observed in elliptical galaxies (Mathews & Brighenti 2003). While both density profiles are smooth, the steeper gradient observed in MRK 1216 points to a more concentrated hot gas distribution compared to PGC 32873. The entropy profile of MRK 1216 increases with the radius following K ∝ r0.88. This profile is broadly in line with, but slightly shallower than, the theoretical K ∝ r1.1 profile expected for systems where the hot atmosphere is shaped solely by gravitational forces (e.g. Voit et al. 2005; Babyk et al. 2018). In contrast, PGC 32873 shows a shallower entropy profile with a power-law slope of Γ = 0.58, and features a flattened core. For MRK 1216, we measure a cooling time of tcool = 20.4 ± 3.7 Myr within 0.5 kpc, and tcool = 137.9 ± 57.2 Myr for PGC 32873 within 1 kpc.
In Werner et al. (2018), the authors provide a detailed explanation of the short central cooling time of MRK 1216 linking the absence of star formation with radio-mechanical AGN feedback. While PGC 32873’s cooling time is slightly longer than that of MRK 1216, it is still relatively short for a galaxy without ongoing star formation, indicating the presence of a heating mechanism in this system as well. In addition, the flat central entropy distribution in PGC 32873 and the high central temperature are also unmistakable signs of heating (see e.g. Werner et al. 2012; Lakhchaura et al. 2018). In comparison, the central entropy distribution in MRK 1216 is steeper and monotonously increasing, but its index is also flatter than 1.1 expected for pure gravitational heating. In addition, the flattened central entropy profile of PGC 32873 may reflect a more violent or more recent episode of AGN feedback compared to MRK 1216. Recently, Fabian et al. (2023) tested a hidden (absorbed) cooling flow (HCF) model, and showed that if such a model applies, the implied cooling rate could be as high as 9.7 ± 2.7 M⊙ yr−1. However, the current RGS data is not constraining enough to reliably determine the presence of a multi-temperature structure, such as the HCF model (see Section 4.6).
4.6. High-resolution spectrum of MRK 1216
We modeled the RGS spectrum extracted from a 0.5 arcmin wide region with an absorbed collisionally ionised equilibrium (CIE) plasma model using the SPEX spectral fitting package version 3.08.01, which uses the atomic database SPEXACT 2.07.00 (Kaastra et al. 2024) in the 8–21 Å band. We first fit a multi-temperature differential emission measure model with a Gaussian emission measure distribution (see gdem in de Plaa et al. 2017). However, the best-fit model did not provide a significant σ parameter, and therefore, was consistent with a single temperature. The best-fit parameters of the single-temperature model are given in Table 5. We note that systematic uncertainties in abundances due to temperature structure are estimated to be on the order of ∼20% (de Plaa et al. 2017), which remain smaller than the statistical uncertainties on our measured RGS abundances. Therefore, fitting with a multi-temperature model is not expected to significantly alter the abundance results.
Best-fit model parameters for a single-temperature CIE model fit to the RGS spectra of MRK 1216.
The RGS spectrum allows us to detect the abundances of O, Ne, Mg, and Fe at the ∼3σ confidence level. The best-fit abundance ratios with respect to Fe hint at super-Solar values: O/Fe = 1.3 ± 0.6 Solar, Ne/Fe = 1.4 ± 0.7 Solar, and Mg/Fe = 2.1 ± 0.9 Solar.
5. Discussion
Out of the seven observed compact relic galaxies, MRK 1216 and PGC 32873 show significant extended X-ray emission originating from hot, diffuse atmospheres (see also Werner et al. 2018; Buote & Barth 2018, 2019). In comparison, NGC 472 and PGC 70520 are X-ray underluminous. The low X-ray luminosity might be the result of a lower halo mass, possibly combined with radio-mechanical AGN feedback blowing the hot gas out to larger radii. This diversity is reminiscent of the wide range of X-ray properties observed in the general population of local elliptical galaxies (e.g. Bogdán et al. 2012b; Gendron-Marsolais et al. 2017). For the three galaxies only observed by XMM-Newton, the present data do not allow us to determine the presence or absence of hot X-ray emitting atmospheres.
The stellar population of MRK 1216 has, similarly to most giant ellipticals (Conroy et al. 2014), high α/Fe abundance ratios (Ferré-Mateu et al. 2017), and therefore, we would expect that the continuous, ongoing enrichment by thermalised stellar wind material from this isolated galaxy will also result in super-solar atmospheric α/Fe abundance ratios. This would be contrary to the measurements of almost all giant ellipticals observed by XMM-Newton RGS (de Plaa et al. 2017; Mernier et al. 2018; Werner et al. 2019) other than perhaps NGC4552 (Kara et al. 2024). However, given that contrary to giant ellipticals, this galaxy evolved in relative isolation, it is plausible that the metal abundance ratios in the CGM of this galaxy will reflect the stellar abundances. Unfortunately, even though this observation provides an intriguing hint, due to the large uncertainties, we are unable to make strong conclusions about the enrichment of this potentially ancient galactic atmosphere.
These X-ray observations of compact relic galaxies suggest that red nuggets observed at high redshifts (e.g. Daddi et al. 2005) will also have diverse properties of X-ray atmospheres. Unfortunately, even deep observations with future missions with large effective areas, such as NewAthena, will not allow us to study the X-ray atmospheres of red nuggets at redshifts above z ∼ 1. Therefore, massive relic galaxies provide a rare and valuable opportunity to learn about the hot CGM in the early Universe.
5.1. Comparison with the general galaxy population
In this section, we compare key properties (LX, Mvir, and MBH) of the cE galaxies with those of the broader galaxy population. This places the cEs in a broader astrophysical context.
Figure 4 shows the 0.5 − 2 keV luminosity (LX) and the virial mass (Mvir) as a function of M★ for the four galaxies in our sample with detected X-ray emission within rvir. To measure LX within rvir, we first determined rvir corresponding to Mvir from the M* − Mvir relation of Behroozi et al. (2019), then estimated the luminosity contribution between 20 reff and rvir, and added it to the luminosity measured within 20 reff. The last step was necessary because the FOV and background level limit the maximum achievable source extraction radius. The 20 rvir − reff luminosity contribution was calculated for a SB distribution described with a single β-model assuming β = 0.6 (e.g. O’Sullivan et al. 2003; Werner et al. 2018). Note that the actual β parameter might vary depending on the specific properties of each galaxy (see Section 4.4), but a value of 0.6 is a reasonable assumption especially for galaxy outskirts, where the X-ray luminosity drops rapidly. We found that the luminosity within the virial radius is dominated by the innermost regions as only 5 − 10% of the total emission originates from the region between 20 reff and rvir. The Mvir was then derived from LX using the correlation for elliptical galaxies from Mathews et al. (2006). As shown in Figure 4, the cE galaxies in our sample show a steeper M★ − LX distribution relative to the power-law trend observed for the CGM in the eROSITA All-Sky Survey Zhang et al. (2024), and are slightly below the M★ − Mvir relation established for quiescent galaxies Behroozi et al. (2019). The latter could hint at a more concentrated dark matter halo structure in cE galaxies compared to the general galaxy population, although the small sample size prevents firm conclusions. It is also consistent with the relatively small β-model core radii we found for the surface brightness profile of MRK 1216 and PGC 32873 (Section 4.4). Note that MRK 1216 and PGC 32873 have virial masses of ≳1013 M⊙, placing them at the low-mass end of the galaxy group mass distribution. Although located in relatively sparse regions with few and less massive companions (particularly MRK 1216; see Section 2), they might be the dominant members of poor galaxy groups.
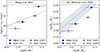 |
Fig. 4. Left: 0.5 − 2 keV MOS1 CGM luminosity of the cE galaxies with detected X-ray emission within rvir as a function of their stellar mass. The shaded region shows the best-fit relation and its 1σ uncertainty from Zhang et al. (2024). Right: Virial mass of cEs calculated from the 0.5 − 2 keV CGM luminosity as a function of stellar mass. The shaded region shows the best-fit relation at z = 0 with its 1σ confidence interval from Behroozi et al. (2019). Overall, based on X-ray measurements, the cEs largely follow both the M★ − LX and the M★ − Mvir relations established for the local galaxy population, however, their virial mass is on the lower side of expectations, possibly hinting at a more compact halo structure. |
Figure 5 shows the positions of the cE galaxies in the M★ − MBH plane, relative to the broader galaxy population. MBH is inferred from the σ central velocity dispersion adopted from Yıldırım et al. (2017). With the exception of NGC 472, cE galaxies follow the relation established for galaxies hosting quiescent BHs, including elliptical galaxies and spiral/S0 galaxies with classical bulges. For reference, we also indicate the relation for AGN host galaxies (Reines & Volonteri 2015). Interestingly, our cE galaxy sample includes four sources that may host AGN based on the present X-ray analysis, yet they still follow the trend of the inactive sample. Note, however, that the AGN sample used by Reines & Volonteri (2015) to establish their relation was primarily identified through optical spectroscopy, specifically by detecting Seyfert-like narrow-line ratios and broad Hα emission. While effective for classifying AGN in sources with strong emission lines, this method may miss heavily obscured or low-luminosity AGNs, which could still be detectable in X-rays.
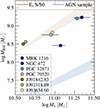 |
Fig. 5. Inferred black hole mass of cE galaxies, estimated from σ, as a function of stellar mass. The cEs in our sample follow the relation observed for inactive elliptical and spiral/S0 galaxies. For comparison, we also include the relation found for local AGNs. Both relations are taken from Reines & Volonteri (2015), with the shaded regions indicating the corresponding 1σ confidence intervals. |
5.2. Connection to LRDs
Little red dots are a recently discovered class of galaxies identified in JWST observations at high redshift, predominantly residing at z = 3 − 7. These galaxies are extremely compact, with effective radii on the order of ∼100 pc (Baggen et al. 2023), and exhibit a distinctive V-shaped spectral energy distribution (SED). Their unusual properties could be explained by either an exceptionally dense stellar population or the presence of a supermassive black hole (SMBH) that is potentially over-massive relative to the stellar mass of its host galaxy when compared to the local MBH − M★ scaling relation. Little red dots have stellar masses of ∼109 M⊙ and black hole masses ranging from 106 to 108 M⊙ (e.g. Matthee et al. 2024; Kocevski et al. 2025).
Despite numerous studies investigating their nature, the origin of LRDs remains debated. Observations report broad Hα emission lines, suggesting the presence of an AGN, yet these galaxies are X-ray weak and lack significant dust, which is typically associated with star formation (Ananna et al. 2024). Additionally, LRDs appear to be relatively common in the early universe, with a number density of 10−4.0 ± 0.1 Mpc−3, accounting for 14 ± 3% of galaxies with similar masses at z ≈ 6.9 (Pérez-González et al. 2024). Given their unique properties and high abundance, LRDs may represent the cores of z ∼ 2 red nuggets and the progenitors of today’s massive elliptical galaxies, as we discuss below.
Red nugget (RN) galaxies, typically observed at z ∼ 2, are more extended than LRDs, with effective radii of ∼1 kpc, and more massive, with M★ ∼ 1011 M⊙. However, they remain significantly more compact than local elliptical galaxies and – similar to LRDs – lie below the M★ − reff relation (Figure 6). Based on this observational evidence, we propose that RNs may have evolved from even more compact progenitors, namely LRDs.
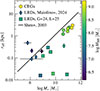 |
Fig. 6. Effective radius as a function of stellar mass for different galaxy samples. The samples include cEs (circles), LRDs from Maiolino et al. (2024) (diamonds), and LRDs with their size and stellar mass adopted from Labbe et al. (2025), and their black hole mass adopted from Greene et al. (2024) (squares). The color of each data point represents the black hole mass as indicated by the color bar. The solid black line shows the relation established by Shen et al. (2003) for local galaxies. |
To assess the viability of this scenario, we estimate the number density of LRDs that could evolve into RNs based on the following considerations. For an LRD to be a viable progenitor of an RN, it must undergo at most a couple of major mergers, as such events could strip LRDs of their distinctive characteristics, particularly their compactness, which resembles that of RN galaxies. Recent studies also suggest that the decline in LRD occurrence from z ≈ 5 is due to mergers erasing their distinctive features (Inayoshi 2025; Kocevski et al. 2025). In addition, based on N-body simulations, the core-scouring effect of supermassive black hole binaries puffs up an initially dense central core (Naab et al. 2009). While minor mergers contribute to building up a galaxy’s outer regions while preserving its dense core, multiple minor mergers ultimately lead to a more extended galaxy than a few major mergers of the same total stellar mass, making them less efficient at driving mass growth (Naab et al. 2009; Bezanson et al. 2009; Rantala et al. 2024). Notably, LRDs must grow by approximately 2 orders of magnitude in both effective radius and stellar mass to acquire characteristics similar to those of RNs. As the z ∼ 2 red nuggets, Mrk 1216 and PGC 032873 exhibit strong rotation and highly peaked velocity dispersion profiles (Ferré-Mateu et al. 2017). However, multiple major mergers can lead to a loss of rotational support (Naab et al. 2009).
These considerations strongly suggest that mergers alone are unlikely to be the primary mechanism for transforming LRDs into RNs. Thus, we estimate the probability of LRDs preserving their distinctive features. We assume an initial LRD number density of 10−4 Mpc−3 at z ≈ 6.9, adopted from Pérez-González et al. (2024). Our estimate spans the period from z = 6.9 to z = 1, where the number density of RNs is well established. Over this redshift range (covering 5.36 Gyr), a typical galaxy experiences ∼0.7 major mergers per Gyr (Duan et al. 2024). Assuming a Poissonian process, the probability of an LRD experiencing one major merger for 5.36 Gyr is ∼10%, yielding a surviving number density of ∼1.0 × 10⁻⁵ Mpc−3. Comparing this to the RN number density at the same redshift (9.8 × 10⁻⁶ Mpc−3, Lisiecki et al. 2023), we find that LRDs could fully account for the observed red nugget population.
In this context, the hidden (by cold absorption) cooling flow rate of ∼10 M⊙ yr−1, which is larger than the rate inferred in typical early-type galaxies (Fabian et al. 2023), together with the observed bottom-heavy initial mass function (MF, Ferré-Mateu et al. 2015), may provide another important clue about galaxy formation. It may indicate that the high thermal pressure in early cooling flows could have led to a bottom-heavy IMF, resulting in the accumulation of low-mass stars in the progenitors of present day massive galaxies (Fabian et al. 2024).
In connecting cEGs with the LRD population, it is also worth noting the so-called green pea galaxies. These compact, star-forming systems at lower redshifts may represent local analogs to certain phases in the evolution of LRDs (Svoboda et al. 2019; Lin et al. 2024).
Current simulations struggle to reproduce the LRD population due to limitations in black hole seeding and stellar feedback modeling. Future simulations that incorporate more sophisticated black hole growth and star formation physics may offer a better understanding of the origin of LRDs.
6. Summary
This study presents the X-ray analysis of seven local compact elliptical galaxies (cEGs), selected for their morphological similarity to high-redshift red nuggets. Using Chandra and XMM-Newton data, our analysis focuses on the properties of the hot gaseous halos surrounding these galaxies. The key findings of our study are as follows.
-
The observed systems exhibit diverse X-ray halo properties, with 0.5–2 keV luminosities spanning ≳2 orders of magnitude among MRK 1216, NGC 472, PGC 32873, and PGC 70520; for the remaining galaxies, observed only with XMM-Newton EPIC, diffuse emission could not be resolved due to a possible central AGN. These results suggest that red nuggets at high redshift might also have diverse X-ray halo properties.
-
MRK 1216 and PGC 32873, the most luminous sources in the sample, exhibit extended X-ray halos reaching ∼10 reff and ∼4 reff, respectively, with corresponding 0.5 − 2 keV luminosities of ∼9 × 1041 erg s−1 and ∼1041 erg s−1.
-
NGC 472 and PGC 70520 appear X-ray underluminous. Their low X-ray luminosities may reflect lower halo masses, potentially coupled with radio-mode AGN feedback expelling hot gas to larger radii.
-
Deprojected thermodynamic profiles for MRK 1216 and PGC 32873 suggest AGN activity, as indicated by central temperature peaks, short central cooling times, and flat entropy slopes.
-
High-resolution RGS spectroscopy of MRK 1216 hints at super-solar O/Fe, Ne/Fe, and Mg/Fe abundance ratios.
-
The cE galaxies exhibit a steeper M★–LX relation compared to the CGM trend from the eROSITA All-Sky Survey, and lie slightly below the M★–Mvir relation for quiescent galaxies, indicating more concentrated dark matter halos.
-
The cE galaxies, with the exception of NGC 472, follow the M★–MBH relation established for quiescent galaxies.
-
cEGs lie below the M★–reff relation, similar to LRD galaxies, hinting at a possible evolutionary connection.
Note that the HRC camera has no useful energy resolution.
Acknowledgments
O. E. K. and N. W. were supported by the GACR EXPRO grant No. 21-13491X. Á. B. acknowledges support from the Smithsonian Institution and the Chandra Project through NASA contract NAS8-03060. The research leading to these results has received funding from the European Union’s Horizon 2020 Programme under the AHEAD2020 project (grant agreement n. 871158).
References
- Ananna, T. T., Bogdán, Á., Kovács, O. E., Natarajan, P., & Hickox, R. C. 2024, ApJ, 969, L18 [NASA ADS] [CrossRef] [Google Scholar]
- Anders, E., & Grevesse, N. 1989, Geochim. Cosmochim. Acta, 53, 197 [Google Scholar]
- Arnaud, K. A. 1996, in Astronomical Data Analysis Software and Systems V, eds. G. H. Jacoby, & J. Barnes, ASP Conf. Ser., 101, 17 [NASA ADS] [Google Scholar]
- Babyk, I. V., McNamara, B. R., Nulsen, P. E. J., et al. 2018, ApJ, 862, 39 [NASA ADS] [CrossRef] [Google Scholar]
- Baggen, J. F. W., van Dokkum, P., Labbé, I., et al. 2023, ApJ, 955, L12 [NASA ADS] [CrossRef] [Google Scholar]
- Behroozi, P., Wechsler, R. H., Hearin, A. P., & Conroy, C. 2019, MNRAS, 488, 3143 [NASA ADS] [CrossRef] [Google Scholar]
- Bell, E. F., McIntosh, D. H., Katz, N., & Weinberg, M. D. 2003, ApJS, 149, 289 [Google Scholar]
- Bezanson, R., van Dokkum, P. G., Tal, T., et al. 2009, ApJ, 697, 1290 [Google Scholar]
- Bogdán, Á., Forman, W. R., Zhuravleva, I., et al. 2012a, ApJ, 753, 140 [Google Scholar]
- Bogdán, Á., David, L. P., Jones, C., Forman, W. R., & Kraft, R. P. 2012b, ApJ, 758, 65 [Google Scholar]
- Bogdán, Á., Bourdin, H., Forman, W. R., et al. 2017, ApJ, 850, 98 [CrossRef] [Google Scholar]
- Bogdán, Á., Goulding, A. D., Natarajan, P., et al. 2024, Nat. Astron., 8, 126 [Google Scholar]
- Buitrago, F., Ferreras, I., Kelvin, L. S., et al. 2018, A&A, 619, A137 [NASA ADS] [CrossRef] [EDP Sciences] [Google Scholar]
- Buote, D. A., & Barth, A. J. 2018, ApJ, 854, 143 [NASA ADS] [CrossRef] [Google Scholar]
- Buote, D. A., & Barth, A. J. 2019, ApJ, 877, 91 [NASA ADS] [CrossRef] [Google Scholar]
- Conroy, C., Graves, G. J., & van Dokkum, P. G. 2014, ApJ, 780, 33 [Google Scholar]
- Daddi, E., Renzini, A., Pirzkal, N., et al. 2005, ApJ, 626, 680 [NASA ADS] [CrossRef] [Google Scholar]
- Damjanov, I., McCarthy, P. J., Abraham, R. G., et al. 2009, ApJ, 695, 101 [Google Scholar]
- Davis, J. E., Bautz, M. W., Dewey, D., et al. 2012, in Space Telescopes and Instrumentation 2012: Ultraviolet to Gamma Ray, eds. T. Takahashi, S. S. Murray, & J.-W. A. den Herder, SPIE Conf. Ser., 8443, 84431A [Google Scholar]
- de Plaa, J., Kaastra, J. S., Werner, N., et al. 2017, A&A, 607, A98 [NASA ADS] [CrossRef] [EDP Sciences] [Google Scholar]
- Duan, Q., Li, Q., Conselice, C. J., et al. 2024, MNRAS, submitted [arXiv:2411.04944] [Google Scholar]
- Eckert, D., Finoguenov, A., Ghirardini, V., et al. 2020, Open J. Astrophys., 3, 12 [NASA ADS] [CrossRef] [Google Scholar]
- Fabian, A. C., Sanders, J. S., Ferland, G. J., et al. 2023, MNRAS, 524, 716 [Google Scholar]
- Fabian, A. C., Sanders, J. S., Ferland, G. J., et al. 2024, MNRAS, 531, 267 [Google Scholar]
- Ferré-Mateu, A., Mezcua, M., Trujillo, I., Balcells, M., & van den Bosch, R. C. E. 2015, ApJ, 808, 79 [CrossRef] [Google Scholar]
- Ferré-Mateu, A., Trujillo, I., Martín-Navarro, I., et al. 2017, MNRAS, 467, 1929 [NASA ADS] [Google Scholar]
- Fruscione, A., McDowell, J. C., Allen, G. E., et al. 2006, in Observatory Operations: Strategies, Processes, and Systems, eds. D. R. Silva, & R. E. Doxsey, SPIE Conf. Ser., 6270, 62701V [NASA ADS] [CrossRef] [Google Scholar]
- Gabriel, C. 2017, in The X-ray Universe 2017, eds. J.-U. Ness, & S. Migliari, 84 [Google Scholar]
- Gendron-Marsolais, M., Kraft, R. P., Bogdan, A., et al. 2017, ApJ, 848, 26 [NASA ADS] [CrossRef] [Google Scholar]
- Gilfanov, M. 2004, MNRAS, 349, 146 [NASA ADS] [CrossRef] [Google Scholar]
- Goudfrooij, P., & de Jong, T. 1995, A&A, 298, 784 [NASA ADS] [Google Scholar]
- Greene, J. E., Labbe, I., Goulding, A. D., et al. 2024, ApJ, 964, 39 [CrossRef] [Google Scholar]
- Inayoshi, K. 2025, ApJ, 988, L22 [Google Scholar]
- Irwin, J. A., Athey, A. E., & Bregman, J. N. 2003, ApJ, 587, 356 [NASA ADS] [CrossRef] [Google Scholar]
- Kaastra, J. S., Raassen, A. J. J., de Plaa, J., & Gu, L. 2024, SPEX X-ray Spectral Fitting Package [Google Scholar]
- Kara, S., Plšek, T., Protušová, K., et al. 2024, MNRAS, 528, 1500 [Google Scholar]
- Kim, D.-W., & Fabbiano, G. 2004, ApJ, 611, 846 [NASA ADS] [CrossRef] [Google Scholar]
- Kocevski, D. D., Finkelstein, S. L., Barro, G., et al. 2025, ApJ, 986, 126 [Google Scholar]
- Kovács, O. E., Zhu, Z., Werner, N., Simionescu, A., & Bogdán, Á. 2023, A&A, 678, A91 [NASA ADS] [CrossRef] [EDP Sciences] [Google Scholar]
- Kovács, O. E., Bogdán, Á., Natarajan, P., et al. 2024, ApJ, 965, L21 [CrossRef] [Google Scholar]
- Labbe, I., Greene, J. E., Bezanson, R., et al. 2025, ApJ, 978, 92 [NASA ADS] [CrossRef] [Google Scholar]
- Lakhchaura, K., Werner, N., Sun, M., et al. 2018, MNRAS, 481, 4472 [NASA ADS] [CrossRef] [Google Scholar]
- Libeskind, N. I., Knebe, A., Hoffman, Y., et al. 2011, MNRAS, 411, 1525 [NASA ADS] [CrossRef] [Google Scholar]
- Lin, R., Zheng, Z.-Y., Jiang, C., et al. 2024, Discovery of Local Analogs to JWST’s Little Red Dots [Google Scholar]
- Lisiecki, K., Małek, K., Siudek, M., et al. 2023, A&A, 669, A95 [NASA ADS] [CrossRef] [EDP Sciences] [Google Scholar]
- Liu, A., Bulbul, E., Ghirardini, V., et al. 2022, A&A, 661, A2 [NASA ADS] [CrossRef] [EDP Sciences] [Google Scholar]
- Lodders, K., & Palme, H. 2009, Meteorit. Planet. Sci, 72, 5154 [Google Scholar]
- Maiolino, R., Scholtz, J., Curtis-Lake, E., et al. 2024, A&A, 691, A145 [NASA ADS] [CrossRef] [EDP Sciences] [Google Scholar]
- Mathews, W. G., & Brighenti, F. 2003, ARA&A, 41, 191 [NASA ADS] [CrossRef] [Google Scholar]
- Mathews, W. G., Brighenti, F., Faltenbacher, A., et al. 2006, ApJ, 652, L17 [Google Scholar]
- Matthee, J., Naidu, R. P., Brammer, G., et al. 2024, ApJ, 963, 129 [NASA ADS] [CrossRef] [Google Scholar]
- Mernier, F., Werner, N., de Plaa, J., et al. 2018, MNRAS, 480, L95 [Google Scholar]
- Naab, T., Johansson, P. H., & Ostriker, J. P. 2009, ApJ, 699, L178 [Google Scholar]
- Oser, L., Ostriker, J. P., Naab, T., Johansson, P. H., & Burkert, A. 2010, ApJ, 725, 2312 [Google Scholar]
- O’Sullivan, E., Ponman, T. J., & Collins, R. S. 2003, MNRAS, 340, 1375 [CrossRef] [Google Scholar]
- Park, T., Kashyap, V. L., Siemiginowska, A., et al. 2006, ApJ, 652, 610 [Google Scholar]
- Peralta de Arriba, L., Quilis, V., Trujillo, I., Cebrián, M., & Balcells, M. 2016, MNRAS, 461, 156 [NASA ADS] [CrossRef] [Google Scholar]
- Pérez-González, P. G., Barro, G., Rieke, G. H., et al. 2024, ApJ, 968, 4 [CrossRef] [Google Scholar]
- Quilis, V., & Trujillo, I. 2013, ApJ, 773, L8 [NASA ADS] [CrossRef] [Google Scholar]
- Rantala, A., Rawlings, A., Naab, T., Thomas, J., & Johansson, P. H. 2024, MNRAS, 535, 1202 [Google Scholar]
- Reines, A. E., & Volonteri, M. 2015, ApJ, 813, 82 [NASA ADS] [CrossRef] [Google Scholar]
- Shen, S., Mo, H. J., White, S. D. M., et al. 2003, MNRAS, 343, 978 [NASA ADS] [CrossRef] [Google Scholar]
- Svoboda, J., Douna, V., Orlitová, I., & Ehle, M. 2019, ApJ, 880, 144 [NASA ADS] [CrossRef] [Google Scholar]
- Trujillo, I., Ferré-Mateu, A., Balcells, M., Vazdekis, A., & Sánchez-Blázquez, P. 2014, ApJ, 780, L20 [Google Scholar]
- Voit, G. M., Kay, S. T., & Bryan, G. L. 2005, MNRAS, 364, 909 [NASA ADS] [CrossRef] [Google Scholar]
- Wellons, S., Torrey, P., Ma, C.-P., et al. 2015, MNRAS, 449, 361 [Google Scholar]
- Werner, N., Allen, S. W., & Simionescu, A. 2012, MNRAS, 425, 2731 [NASA ADS] [CrossRef] [Google Scholar]
- Werner, N., Lakhchaura, K., Canning, R. E. A., Gaspari, M., & Simionescu, A. 2018, MNRAS, 477, 3886 [Google Scholar]
- Werner, N., McNamara, B. R., Churazov, E., & Scannapieco, E. 2019, Space Sci. Rev., 215, 5 [CrossRef] [Google Scholar]
- Willingale, R., Starling, R. L. C., Beardmore, A. P., Tanvir, N. R., & O’Brien, P. T. 2013, MNRAS, 431, 394 [Google Scholar]
- Yıldırım, A., van den Bosch, R. C. E., van de Ven, G., et al. 2017, MNRAS, 468, 4216 [Google Scholar]
- Zhang, Z., Gilfanov, M., & Bogdán, Á. 2012, A&A, 546, A36 [NASA ADS] [CrossRef] [EDP Sciences] [Google Scholar]
- Zhang, Y., Comparat, J., Ponti, G., et al. 2024, A&A, 690, A268 [NASA ADS] [CrossRef] [EDP Sciences] [Google Scholar]
- Zhu, Z., Kovács, O. E., Simionescu, A., & Werner, N. 2023, A&A, 678, A122 [NASA ADS] [CrossRef] [EDP Sciences] [Google Scholar]
All Tables
Unabsorbed X-ray luminosities of the galactic diffuse emission measured within 20 reff.
Best-fit model parameters for a single-temperature CIE model fit to the RGS spectra of MRK 1216.
All Figures
|
Fig. 1. Left: 0.3 − 2 keV surface brightness profile of MRK 1216. The parameters of the best-fitting β-model are β = 0.507 ± 0.003 and a core radius of rc = 0.874 ± 0.001 kpc. Right: 0.3 − 2 keV surface brightness profile of PGC 32873. The parameters of the best-fitting β-model are β = 0.526 ± 0.011 and rc = 0.492 ± 0.001 kpc. |
| In the text | |
|
Fig. 2. Deprojected thermodynamic profiles of the CGM surrounding MRK 1216. The profiles, extracted from Chandra ACIS data, show temperature (kT), total density (n = ne + ni), entropy (K), and cooling time (tcool) extending out to ≳20 reff. The effective radius of MRK 1216 is reff = 3.0 kpc, corresponding to 6.8″. |
| In the text | |
|
Fig. 3. Deprojected thermodynamic profiles of the CGM surrounding PGC 32873. The profiles, extracted from Chandra ACIS data, show temperature (kT), total density (n = ne + ni), entropy (K), and cooling time (tcool) extending out to ∼3 reff. The effective radius of PGC 32873 is reff = 2.3 kpc, corresponding to 4.4″. |
| In the text | |
|
Fig. 4. Left: 0.5 − 2 keV MOS1 CGM luminosity of the cE galaxies with detected X-ray emission within rvir as a function of their stellar mass. The shaded region shows the best-fit relation and its 1σ uncertainty from Zhang et al. (2024). Right: Virial mass of cEs calculated from the 0.5 − 2 keV CGM luminosity as a function of stellar mass. The shaded region shows the best-fit relation at z = 0 with its 1σ confidence interval from Behroozi et al. (2019). Overall, based on X-ray measurements, the cEs largely follow both the M★ − LX and the M★ − Mvir relations established for the local galaxy population, however, their virial mass is on the lower side of expectations, possibly hinting at a more compact halo structure. |
| In the text | |
|
Fig. 5. Inferred black hole mass of cE galaxies, estimated from σ, as a function of stellar mass. The cEs in our sample follow the relation observed for inactive elliptical and spiral/S0 galaxies. For comparison, we also include the relation found for local AGNs. Both relations are taken from Reines & Volonteri (2015), with the shaded regions indicating the corresponding 1σ confidence intervals. |
| In the text | |
|
Fig. 6. Effective radius as a function of stellar mass for different galaxy samples. The samples include cEs (circles), LRDs from Maiolino et al. (2024) (diamonds), and LRDs with their size and stellar mass adopted from Labbe et al. (2025), and their black hole mass adopted from Greene et al. (2024) (squares). The color of each data point represents the black hole mass as indicated by the color bar. The solid black line shows the relation established by Shen et al. (2003) for local galaxies. |
| In the text | |
Current usage metrics show cumulative count of Article Views (full-text article views including HTML views, PDF and ePub downloads, according to the available data) and Abstracts Views on Vision4Press platform.
Data correspond to usage on the plateform after 2015. The current usage metrics is available 48-96 hours after online publication and is updated daily on week days.
Initial download of the metrics may take a while.