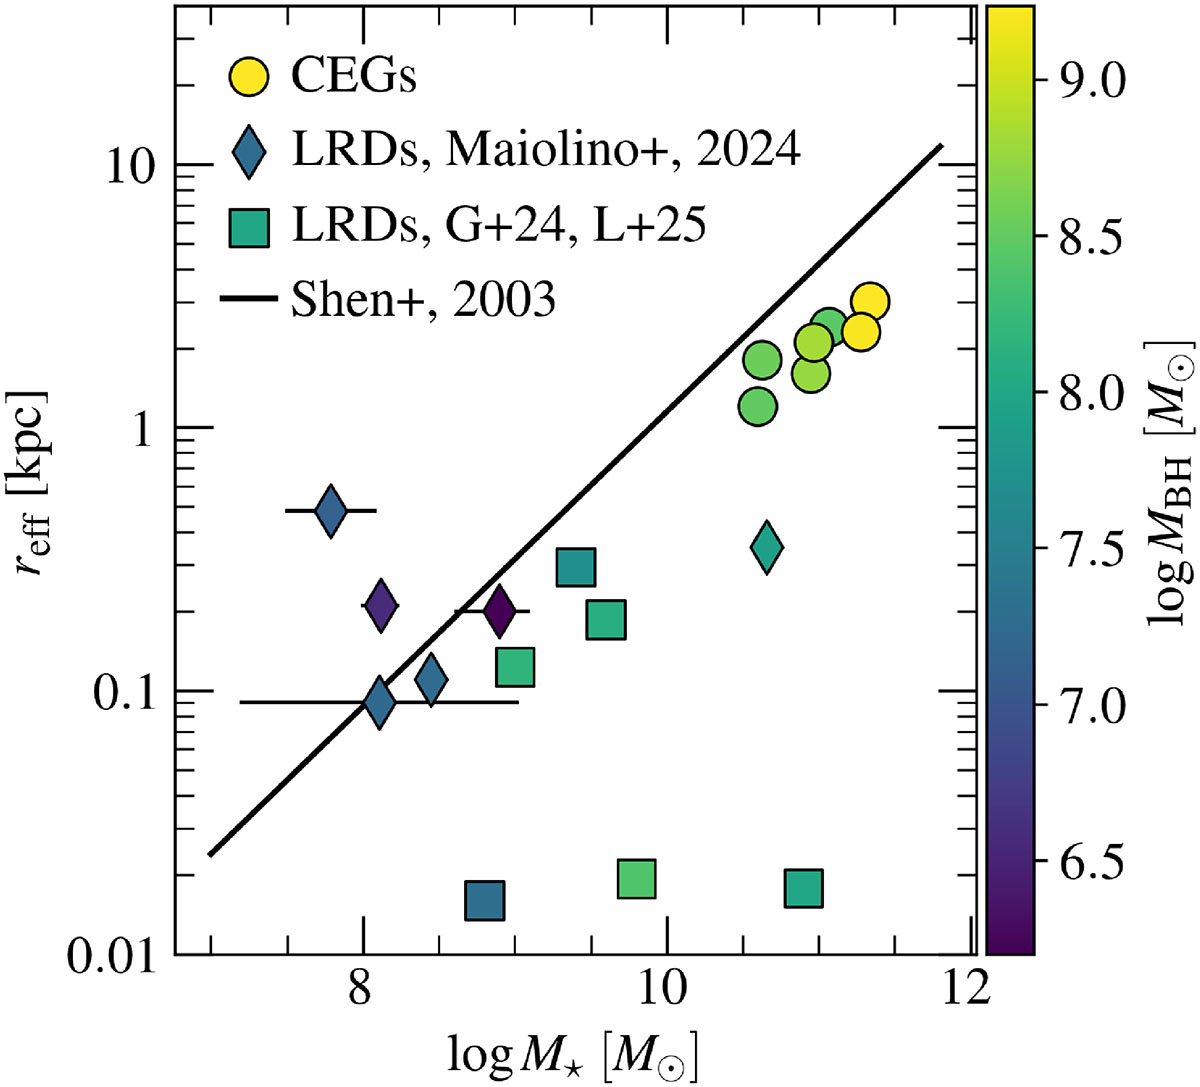
Fig. 6.
Download original image
Effective radius as a function of stellar mass for different galaxy samples. The samples include cEs (circles), LRDs from Maiolino et al. (2024) (diamonds), and LRDs with their size and stellar mass adopted from Labbe et al. (2025), and their black hole mass adopted from Greene et al. (2024) (squares). The color of each data point represents the black hole mass as indicated by the color bar. The solid black line shows the relation established by Shen et al. (2003) for local galaxies.
Current usage metrics show cumulative count of Article Views (full-text article views including HTML views, PDF and ePub downloads, according to the available data) and Abstracts Views on Vision4Press platform.
Data correspond to usage on the plateform after 2015. The current usage metrics is available 48-96 hours after online publication and is updated daily on week days.
Initial download of the metrics may take a while.