Fig. 1
Download original image
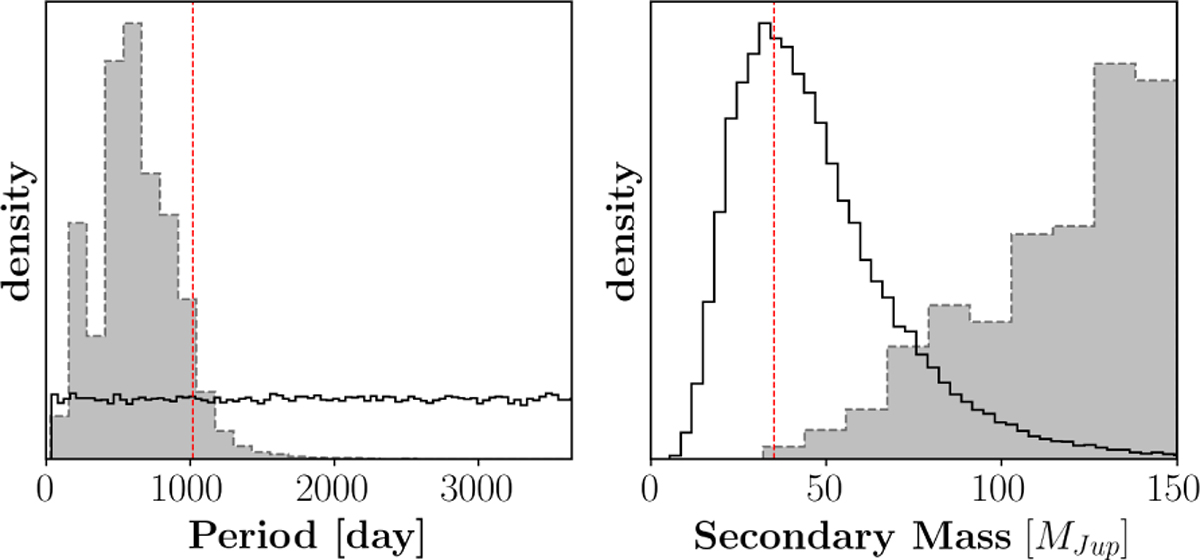
Left: simulated orbital periods (black) compared to the orbital periods from DR3 NSS Orbital solutions (shade), with the DR3 time baseline marked in vertical. Right: simulated secondary masses (black), compared to the catalogue of DR3 binary masses (shade), with the peak of the distribution of simulated secondary masses in vertical.
Current usage metrics show cumulative count of Article Views (full-text article views including HTML views, PDF and ePub downloads, according to the available data) and Abstracts Views on Vision4Press platform.
Data correspond to usage on the plateform after 2015. The current usage metrics is available 48-96 hours after online publication and is updated daily on week days.
Initial download of the metrics may take a while.