Open Access
Fig. 10
Download original image
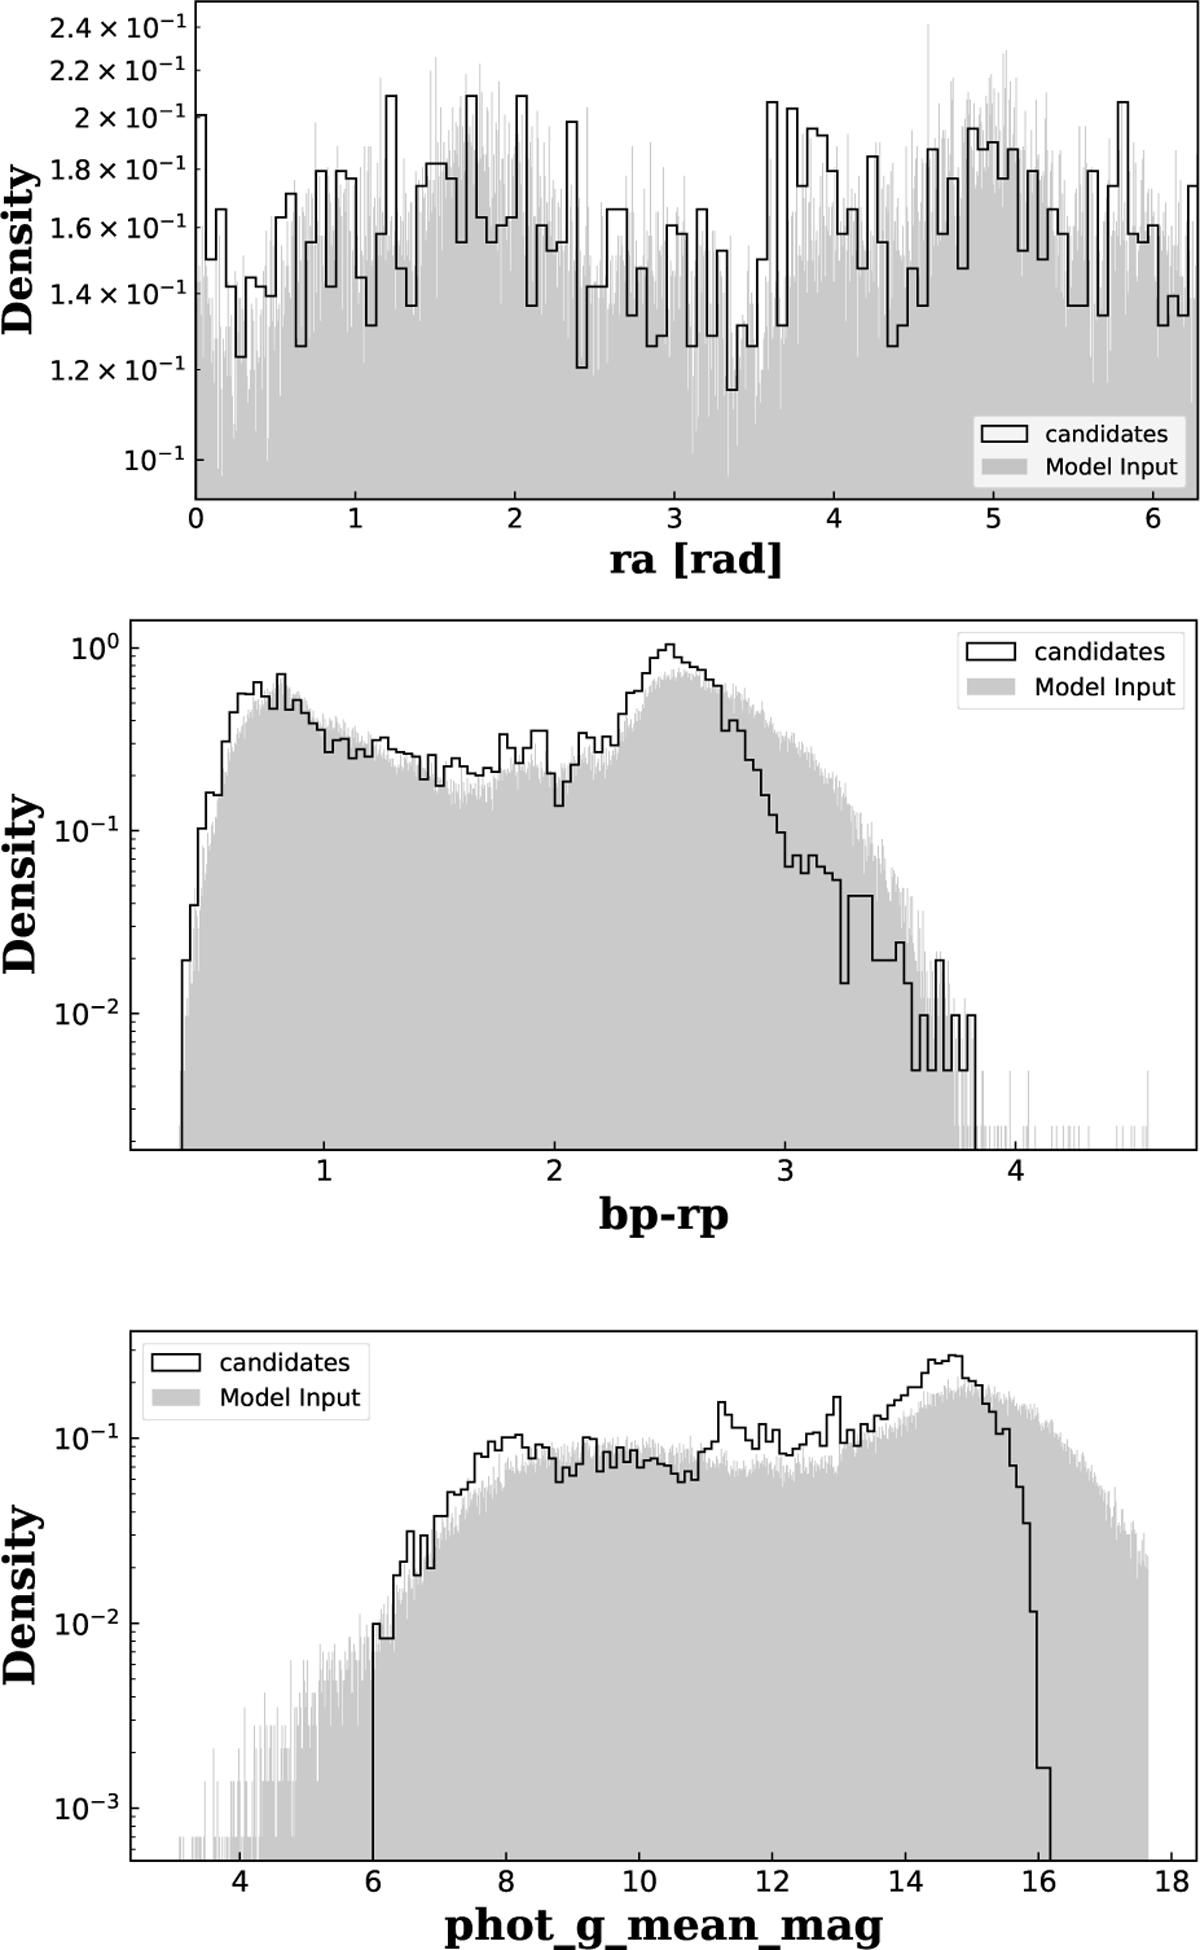
Top: distribution of the right ascension values for candidates sources (solid black line) and the original input for the model (gray) Middle: equivalent display but for Gaia BP minus RP color (bp-rp) distribution. Bottom: equivalent display but for the Gaia magnitude (phot_g_mean_mag) in this case.
Current usage metrics show cumulative count of Article Views (full-text article views including HTML views, PDF and ePub downloads, according to the available data) and Abstracts Views on Vision4Press platform.
Data correspond to usage on the plateform after 2015. The current usage metrics is available 48-96 hours after online publication and is updated daily on week days.
Initial download of the metrics may take a while.